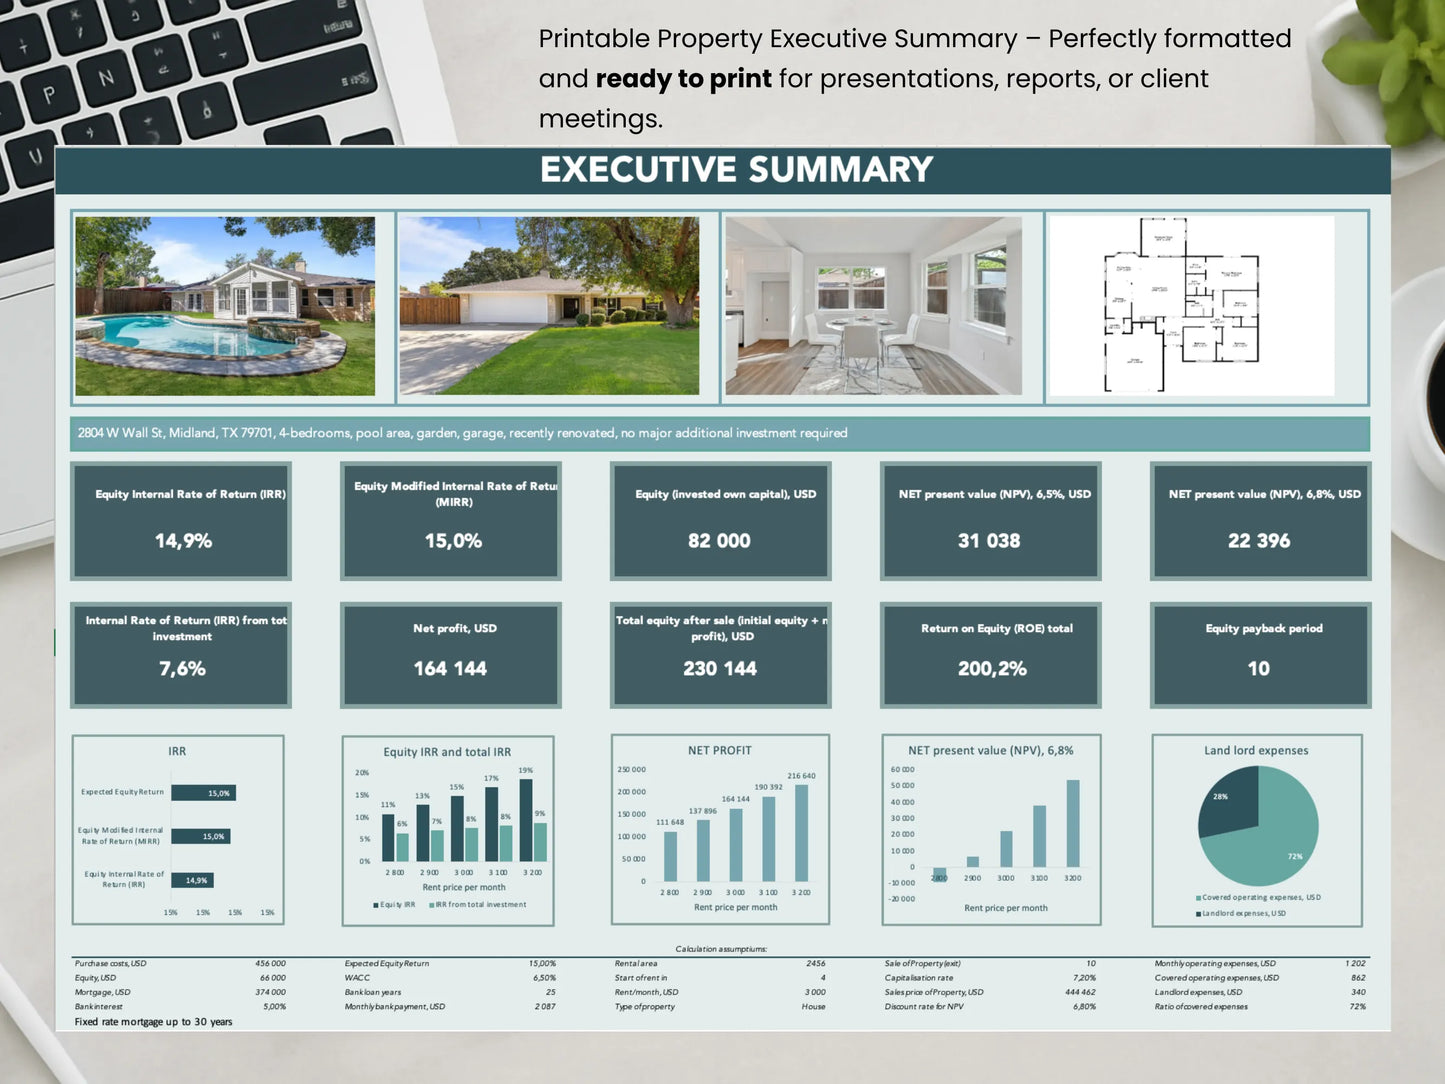

Main KPIs in Real Estate investment analysis
Share
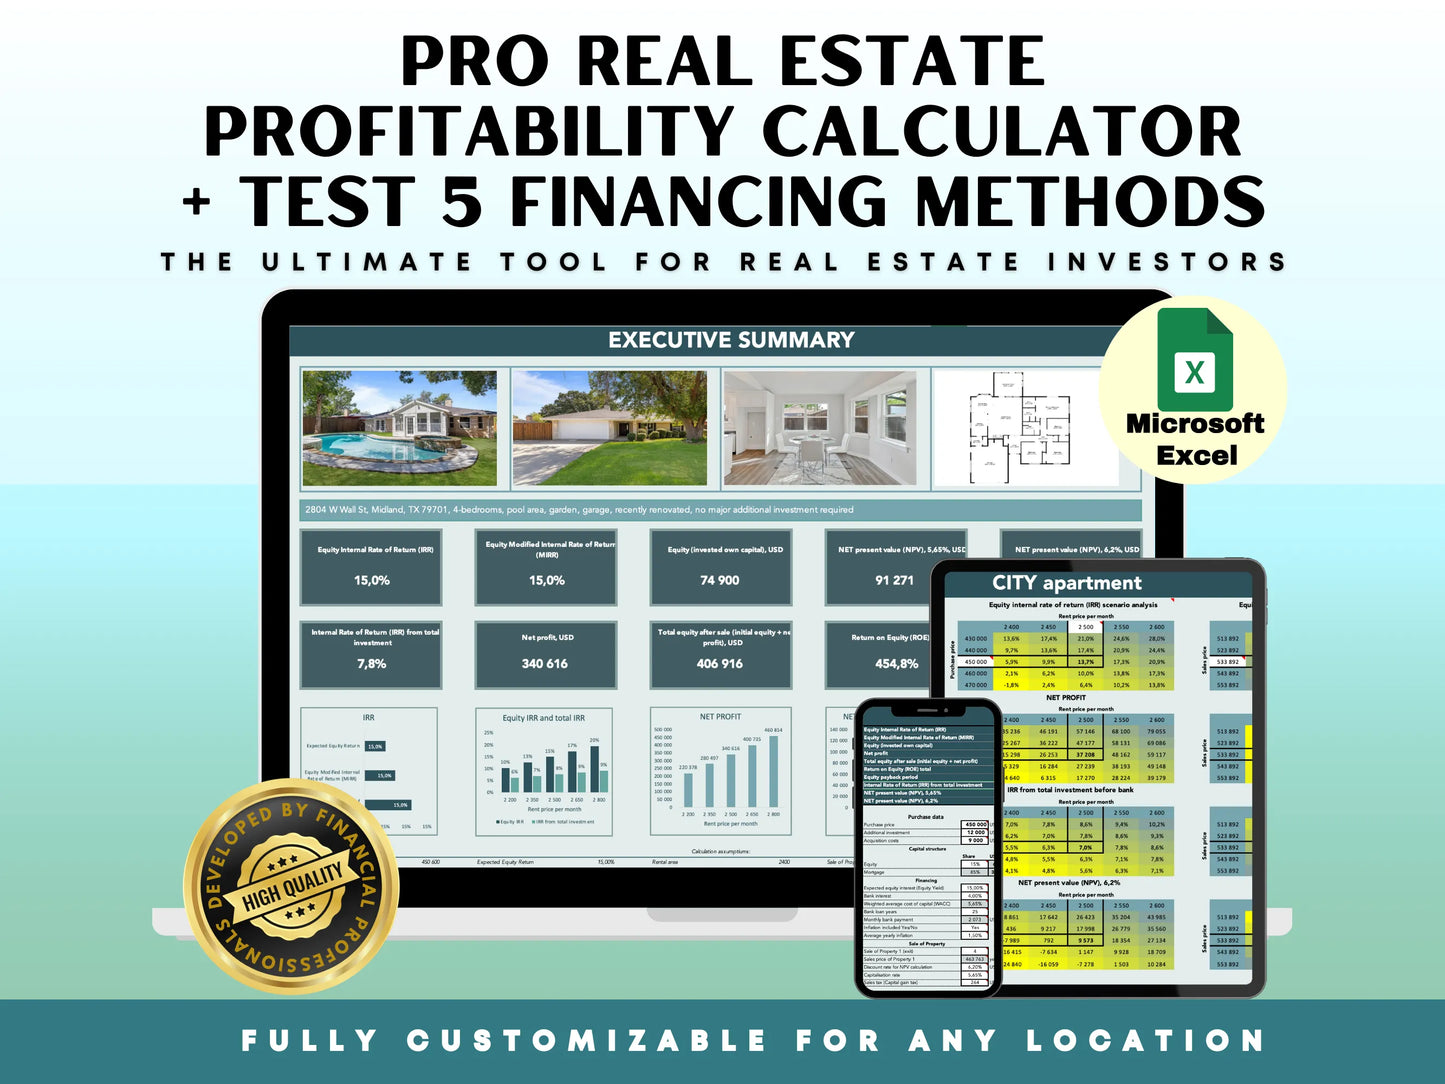
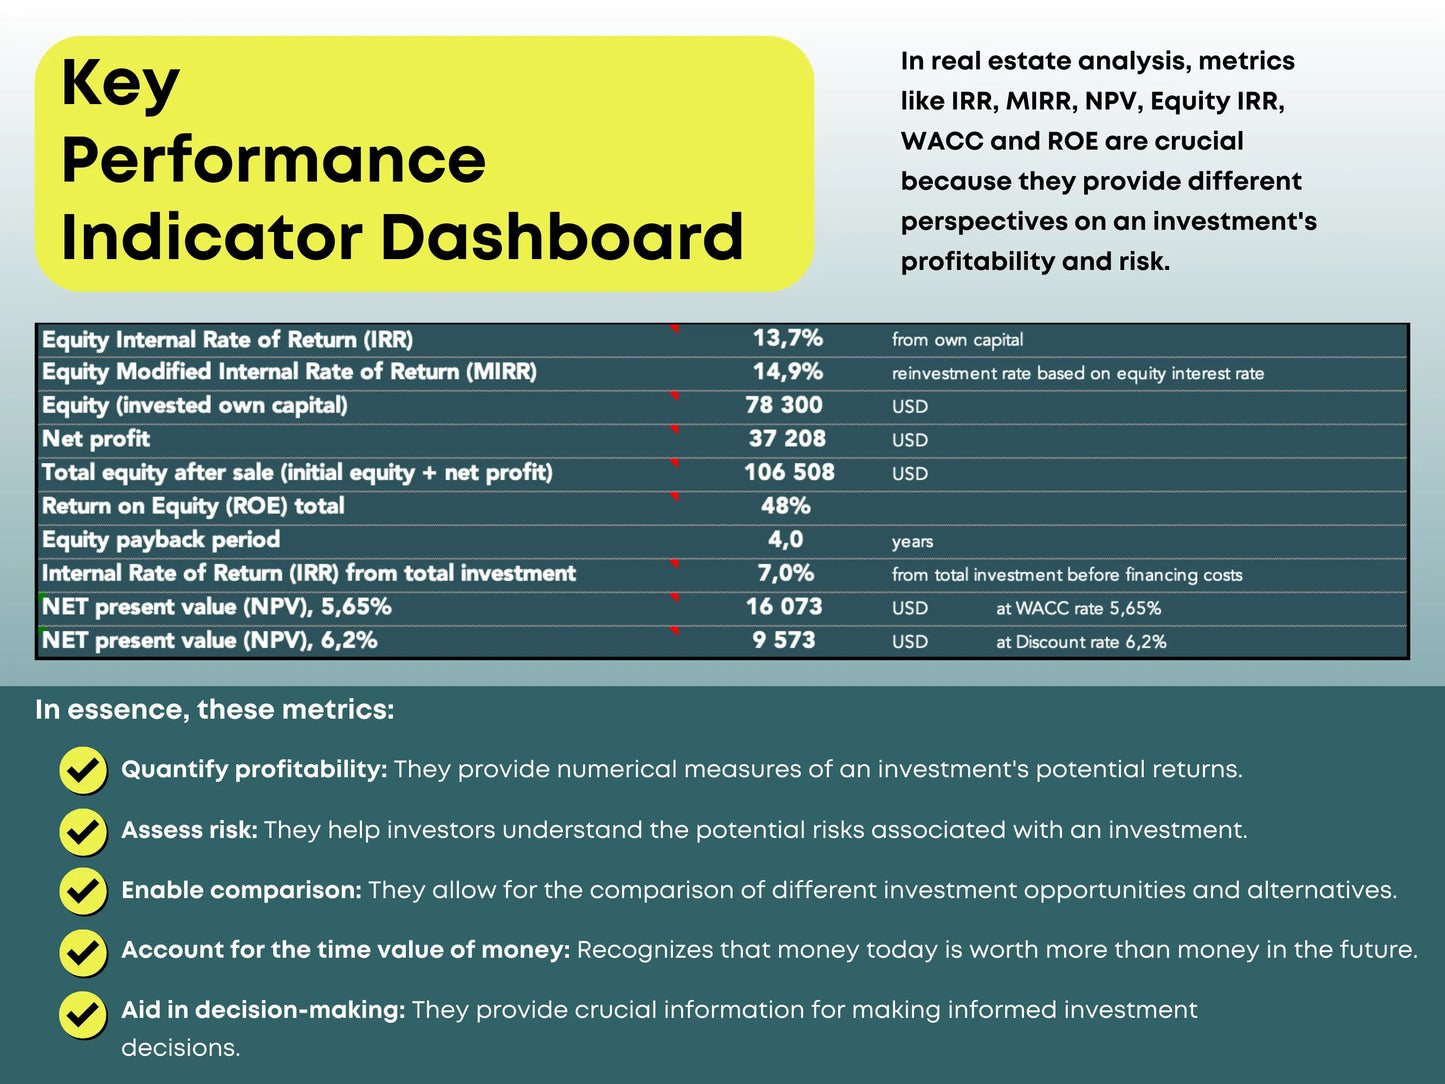
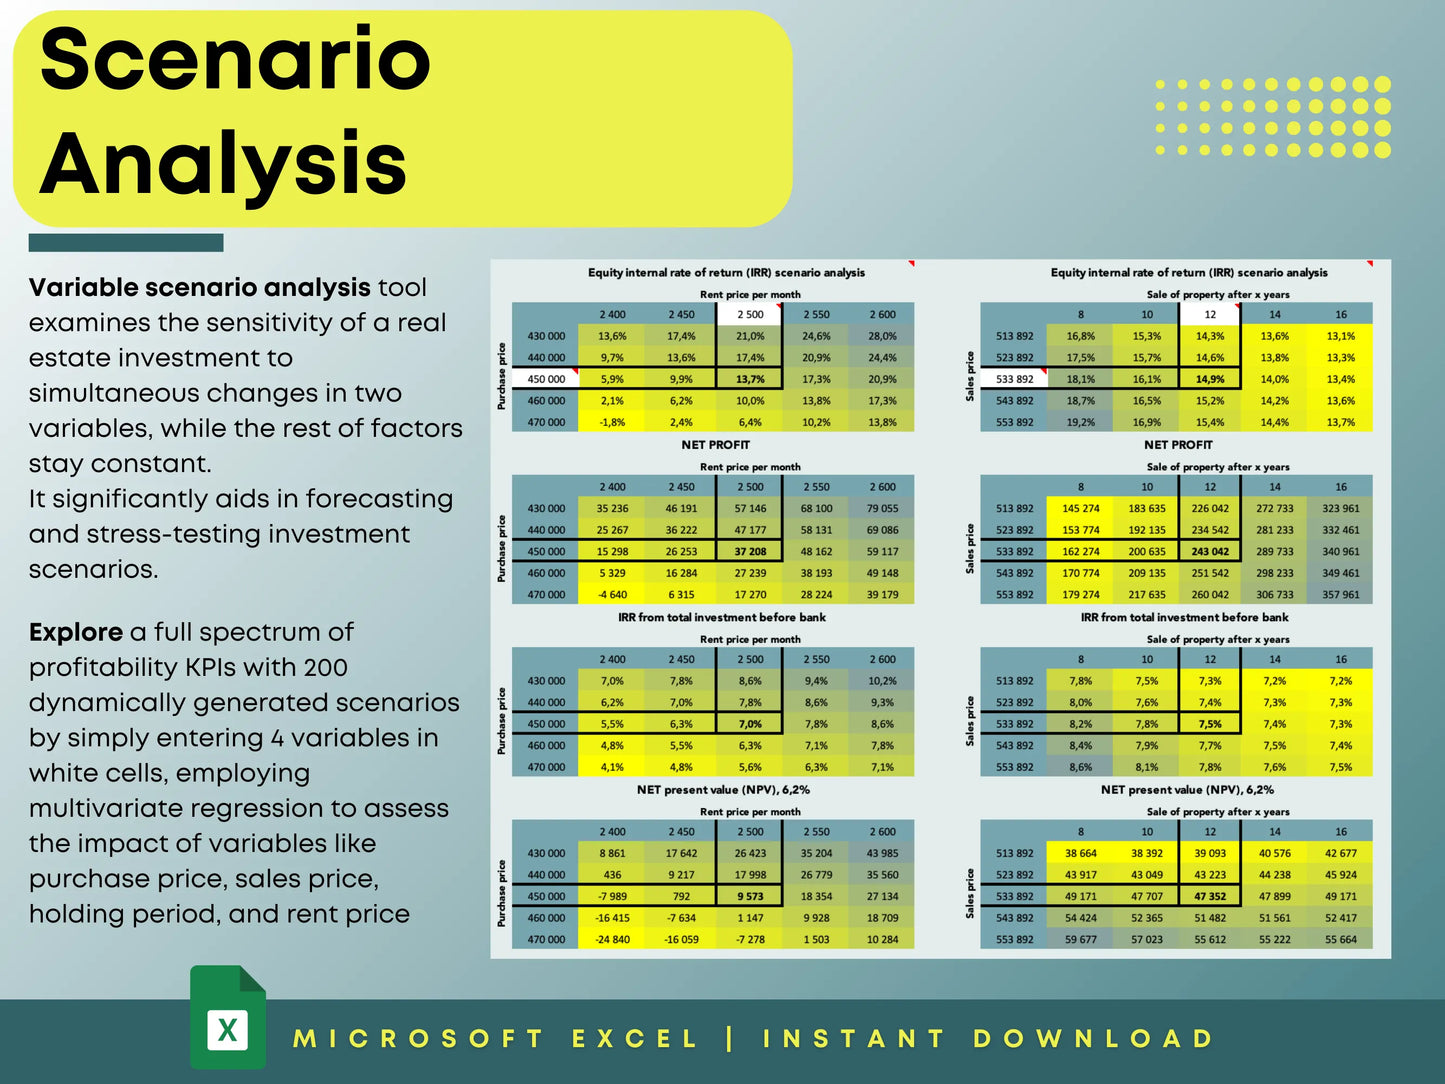
Real estate investment success depends on more than just a good property and a strong location — it’s about knowing the numbers. Smart investors rely on financial analysis tools and metrics such as IRR (Internal Rate of Return), MIRR (Modified Internal Rate of Return), NPV (Net Present Value), Equity IRR, and ROE (Return on Equity) to measure profitability and risk.
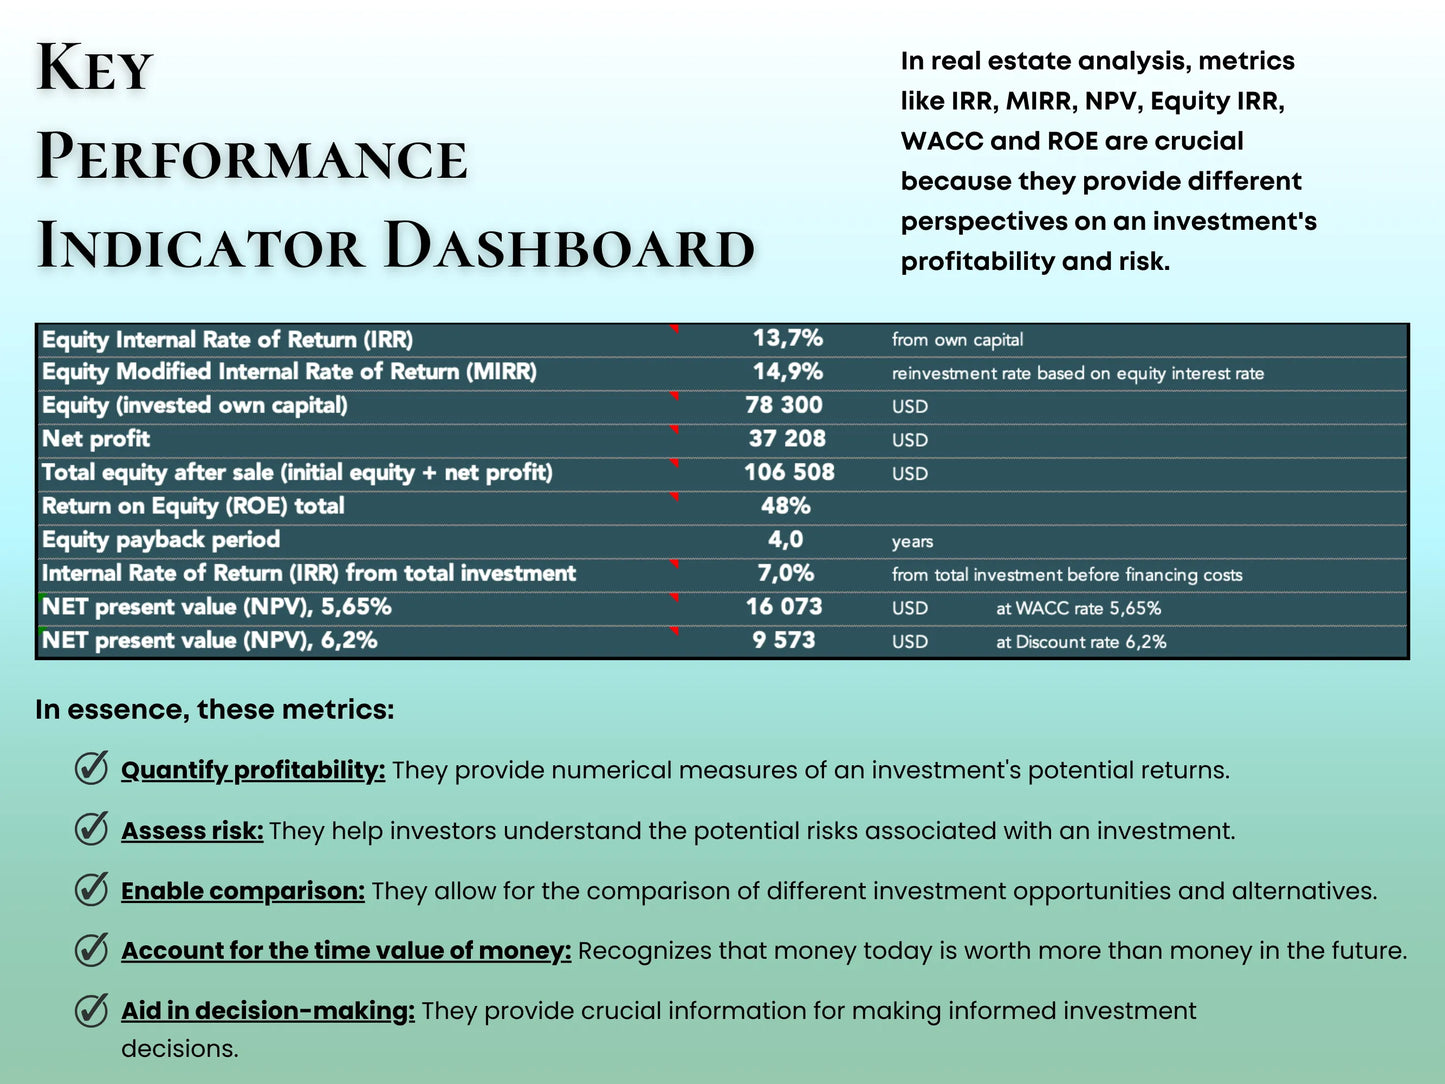
Each of these real estate investment metrics gives a different perspective on how efficiently your capital is working and how sustainable your returns are over time. This guide explains what each metric means, how they connect, and why our real estate investment calculator includes all of them for a complete property analysis.
1. IRR (Internal Rate of Return) — The Core of Real Estate Profitability
Internal Rate of Return (IRR) is one of the most widely used metrics in real estate financial analysis. It represents the annualized rate of return an investment is expected to generate over its lifetime.
In simple terms, IRR tells you how efficiently your money grows within the project. A higher IRR means a more profitable investment, but it’s important to interpret it in context.
Why IRR Matters in Property Investment
- It helps compare different real estate opportunities — for example, whether to invest in an apartment, commercial property, or land development.
- IRR takes into account the time value of money, showing that money earned sooner is worth more than money earned later.
- It’s ideal for long-term real estate investments, where cash flows may vary each year.
How Our Tool Uses IRR
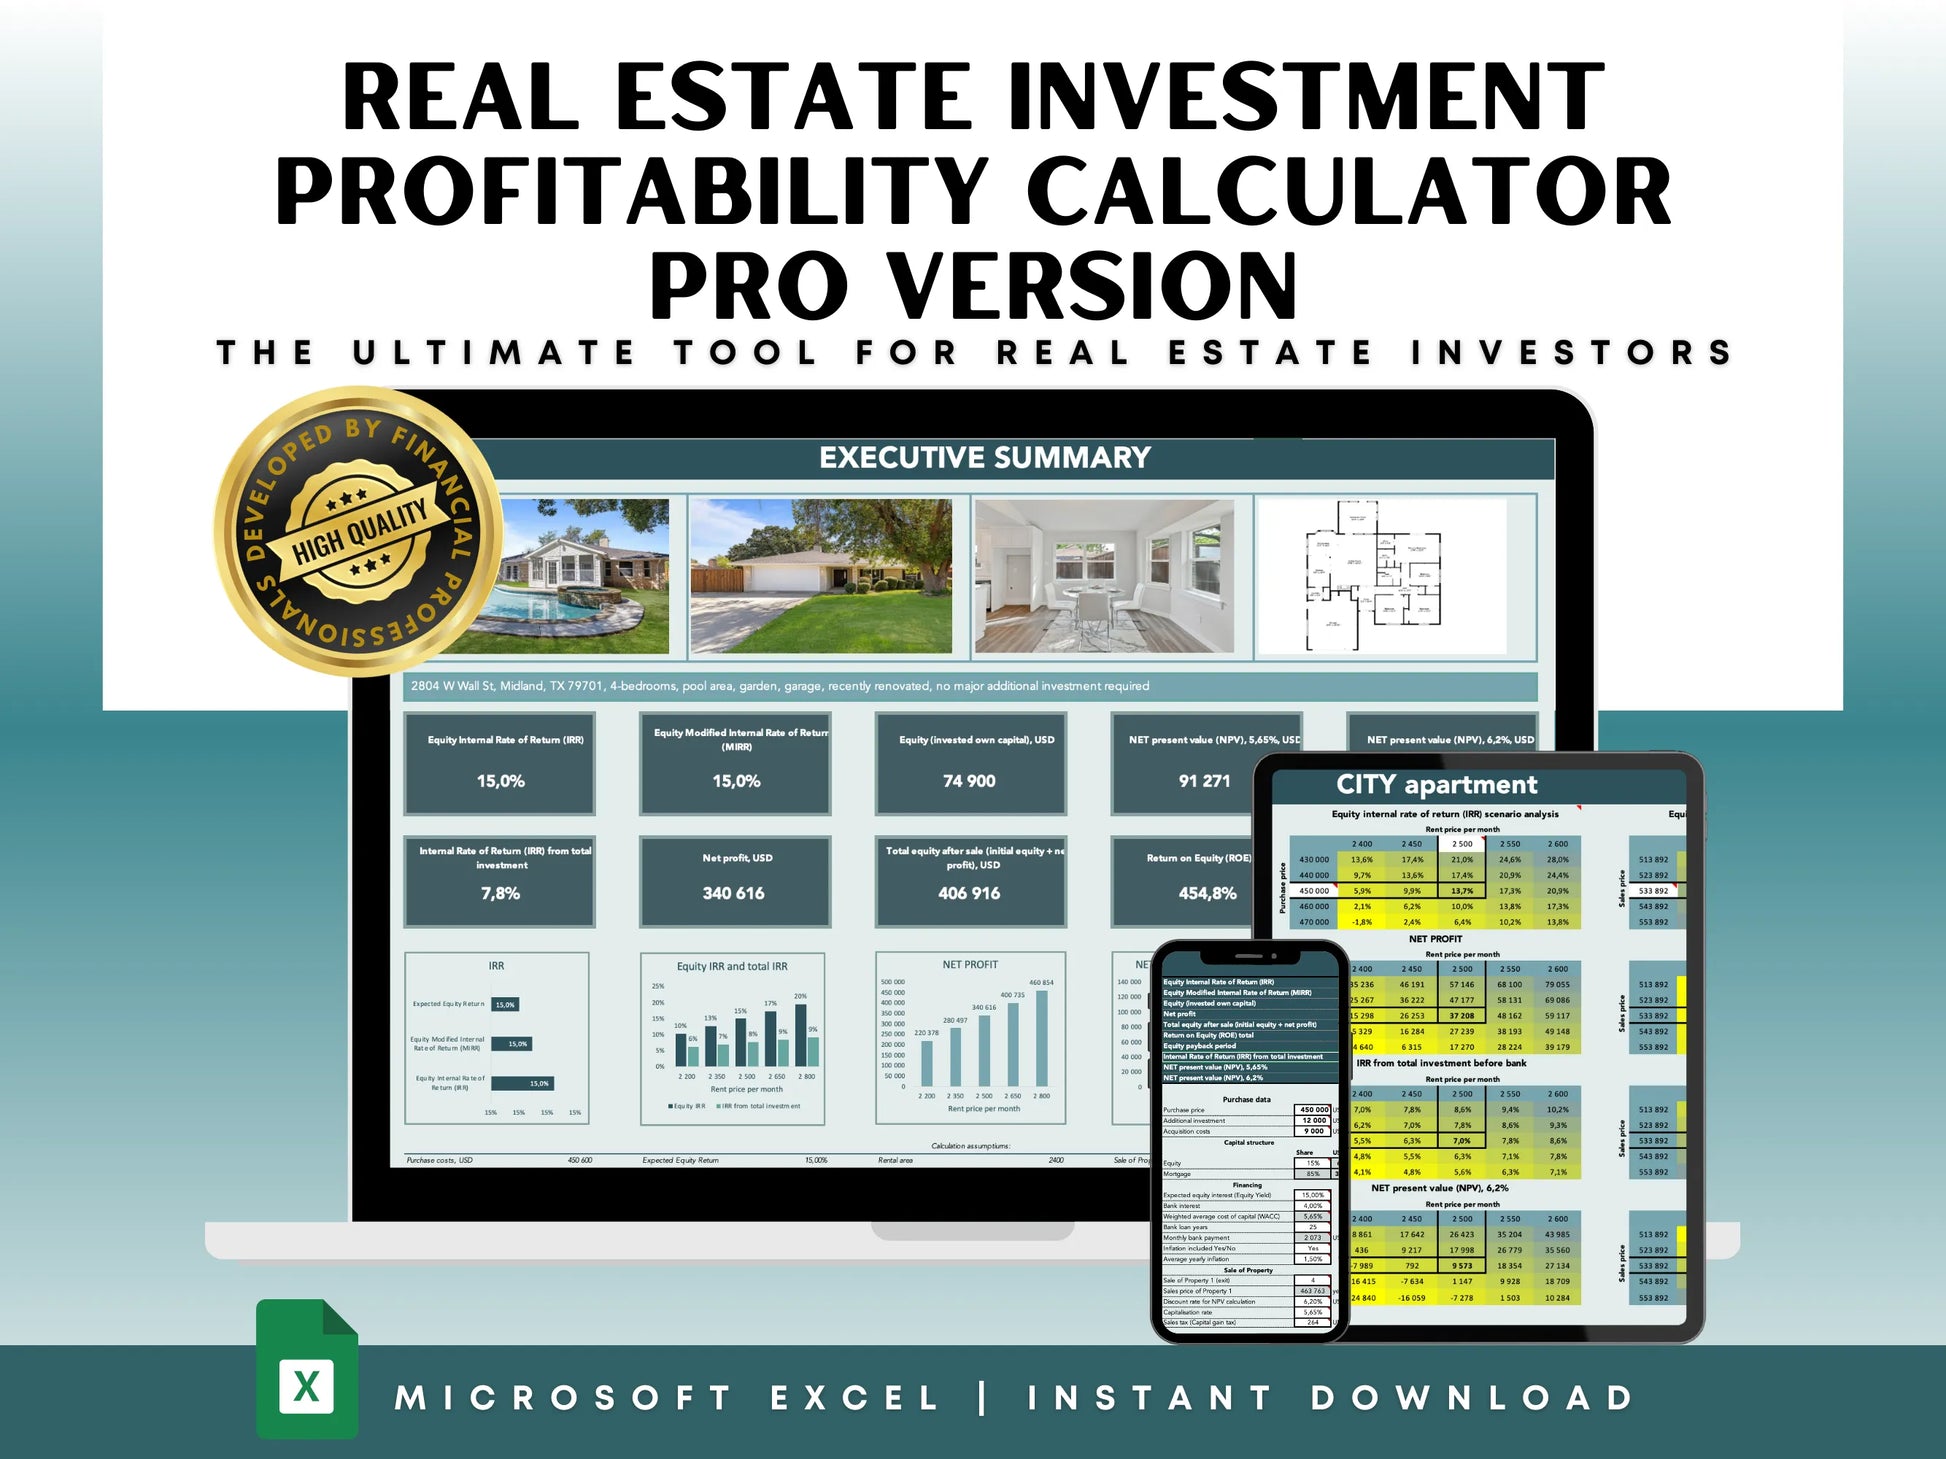
In our real estate profitability spreadsheet, IRR is automatically calculated from your cash flow projections, investment cost, and financing. It shows whether your property meets your target investment return or not — helping you make data-driven decisions.
2. MIRR (Modified Internal Rate of Return) — A More Realistic Profitability View
While IRR is powerful, it assumes that all cash flows are reinvested at the same rate — which is rarely true in the real world. That’s where MIRR (Modified Internal Rate of Return) comes in.
What MIRR Does Differently
- MIRR adjusts for different reinvestment rates, giving a more realistic view of your expected property returns.
- It helps you analyze whether your reinvested cash flows will grow at your desired equity yield or a lower, safer rate.
- In our tool, you can manually enter your reinvestment rate — usually equal to your target equity yield — and immediately see how that impacts total returns.
Why MIRR Is Useful for Real Estate Investors
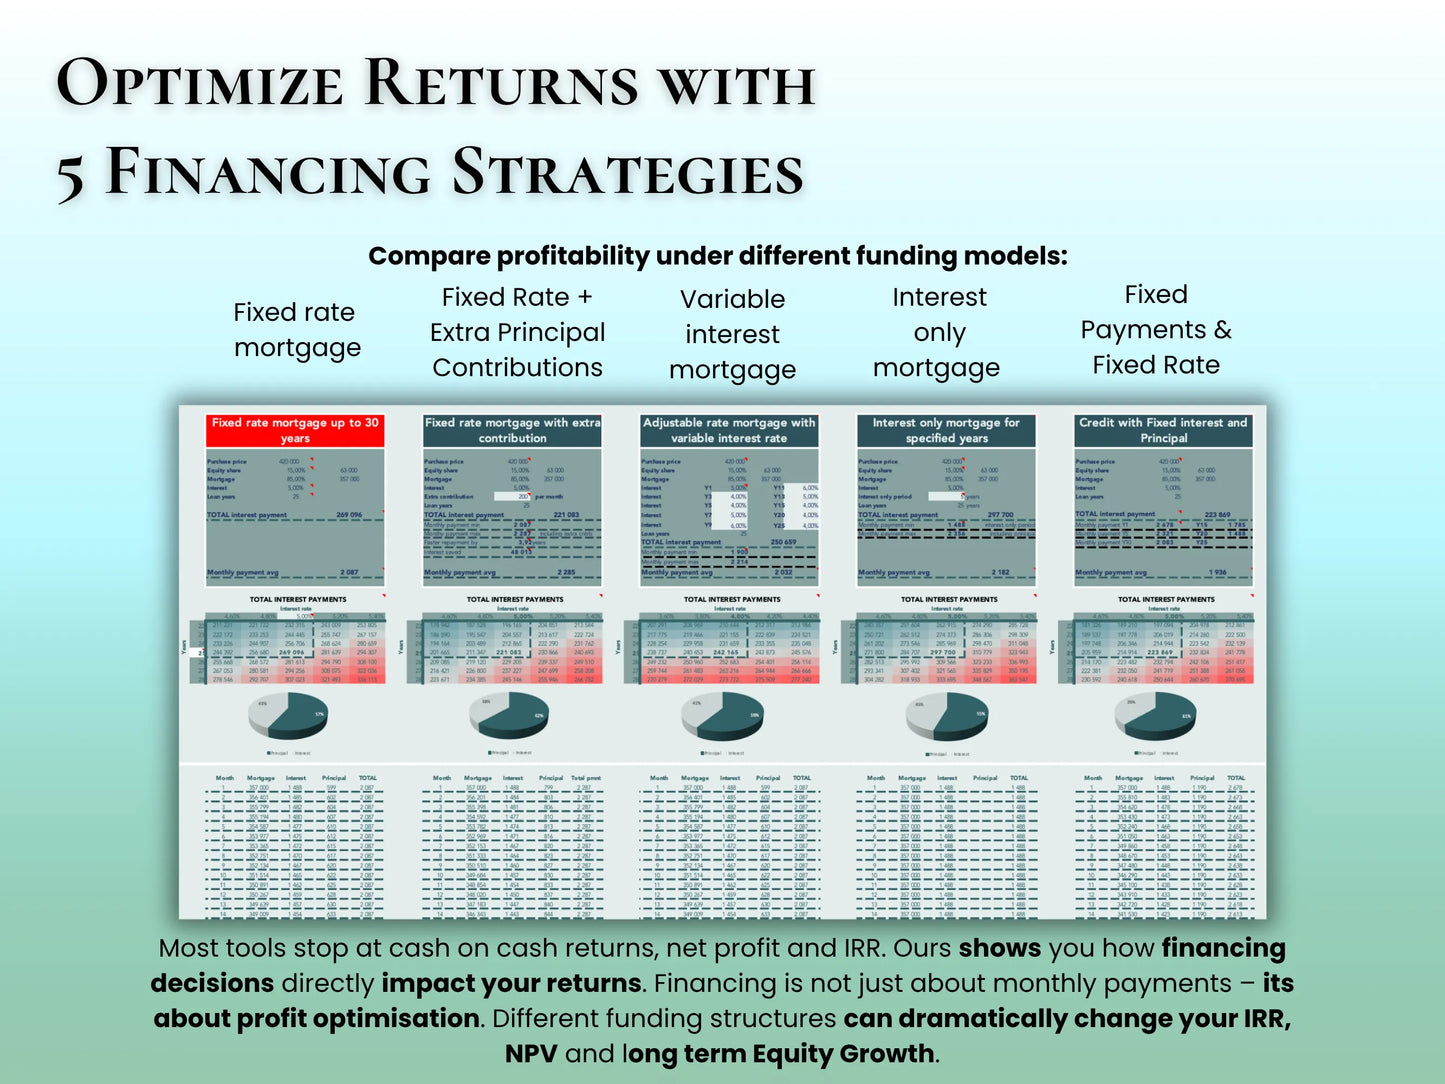
MIRR is particularly valuable for comparing financed vs. cash-only property deals, where the timing and reinvestment of cash flows can drastically change the results.
3. NPV (Net Present Value) — The Measure of Real Value Creation
Net Present Value (NPV) calculates the current value of all future cash flows, discounted back to today. It answers a simple question: After considering time and financing costs, is this property still worth it?
How NPV Works
- A positive NPV means your investment is expected to generate a return above your target rate — meaning you’ll achieve your equity yield and cover bank interest.
- A negative NPV signals that the property won’t meet your expected return or may lose value after financing costs are considered.
- NPV accounts for the time value of money, making it one of the most reliable indicators for long-term investment profitability.
In Our Real Estate Calculator
The tool automatically computes NPV based on your entered cash flows, discount rate, and financing terms. You can instantly see if the property’s expected income and appreciation justify your investment.
4. Equity IRR — Measuring the True Return on Your Own Capital
While IRR considers total project returns, Equity IRR focuses specifically on the return on your personal equity investment, after accounting for financing and interest payments.
Why Equity IRR Is Essential
- It isolates the investor’s actual profit, excluding bank or mortgage contributions.
- It’s ideal for comparing real estate vs. other investments, such as stocks, bonds, or cryptocurrency.
- It shows how efficiently your personal capital works when leverage (borrowed funds) is used.
For leveraged real estate deals, Equity IRR gives the clearest picture of profitability — it tells you exactly what your own money is earning after all financing costs.
5. ROE (Return on Equity) — Evaluating Capital Efficiency
Return on Equity (ROE) measures how effectively your invested capital generates profit. In real estate, it reveals whether using leverage increases or decreases your returns.
Why ROE Matters
- It’s critical for investors using mortgages or loans, as it shows the impact of leverage.
- A higher ROE means your capital is working efficiently — generating more income for every euro or dollar invested.
- ROE is useful for monitoring long-term property performance, especially when rents, expenses, and loan balances change over time.
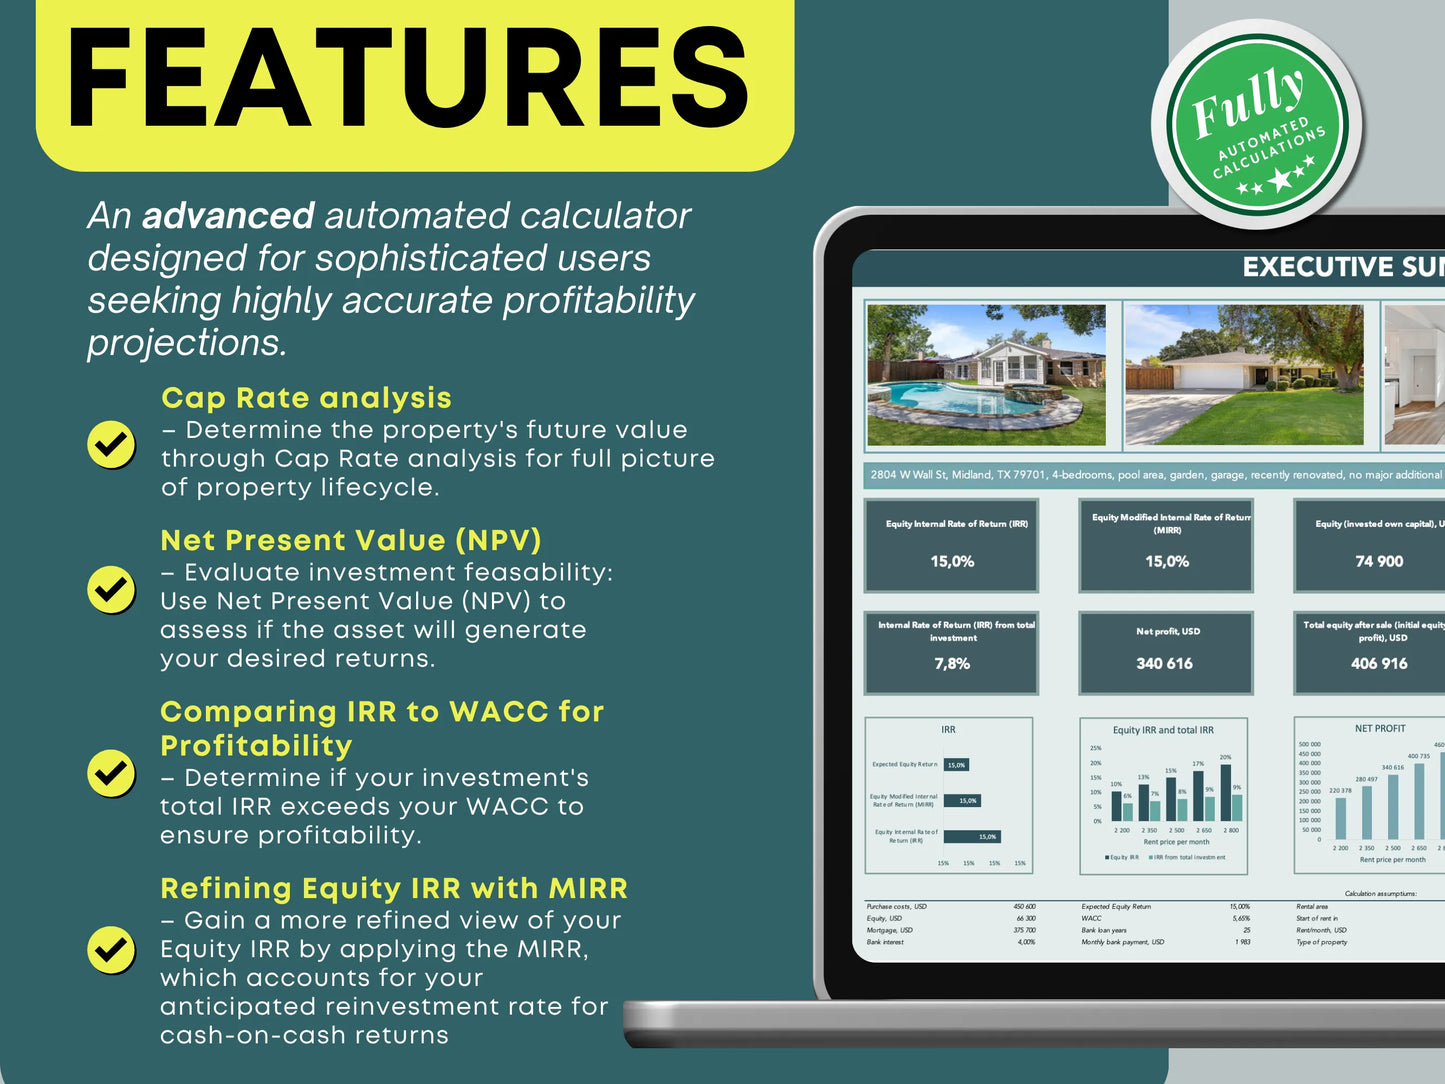
In our calculator, ROE is displayed annually, allowing you to see how your returns evolve as the mortgage decreases and equity grows.
6. WACC (Weighted Average Cost of Capital) — The True Cost of Financing
The Weighted Average Cost of Capital (WACC) represents the average cost of funding your investment, combining both debt (mortgage interest) and equity (your expected yield).
WACC acts as your minimum acceptable return, also known as the hurdle rate. If your property doesn’t beat this number, it’s not adding value.
IRR vs. WACC — The Key Relationship
- WACC is the baseline — your cost of money.
- IRR is your expected return — your reward for taking risk.
- If IRR > WACC, your investment is creating value.
- If IRR < WACC, the project destroys value, as returns don’t cover financing costs.
Why It’s Important
This comparison is central to capital budgeting and real estate portfolio decisions. Always choose projects with IRR higher than WACC — those are the ones that grow your wealth over time.
7. Making Smarter Real Estate Decisions with Data
Combining IRR, MIRR, NPV, Equity IRR, ROE, and WACC gives investors a 360° view of their property’s financial performance. These indicators don’t just show profitability — they reveal risk levels, cash flow sustainability, and long-term growth potential.
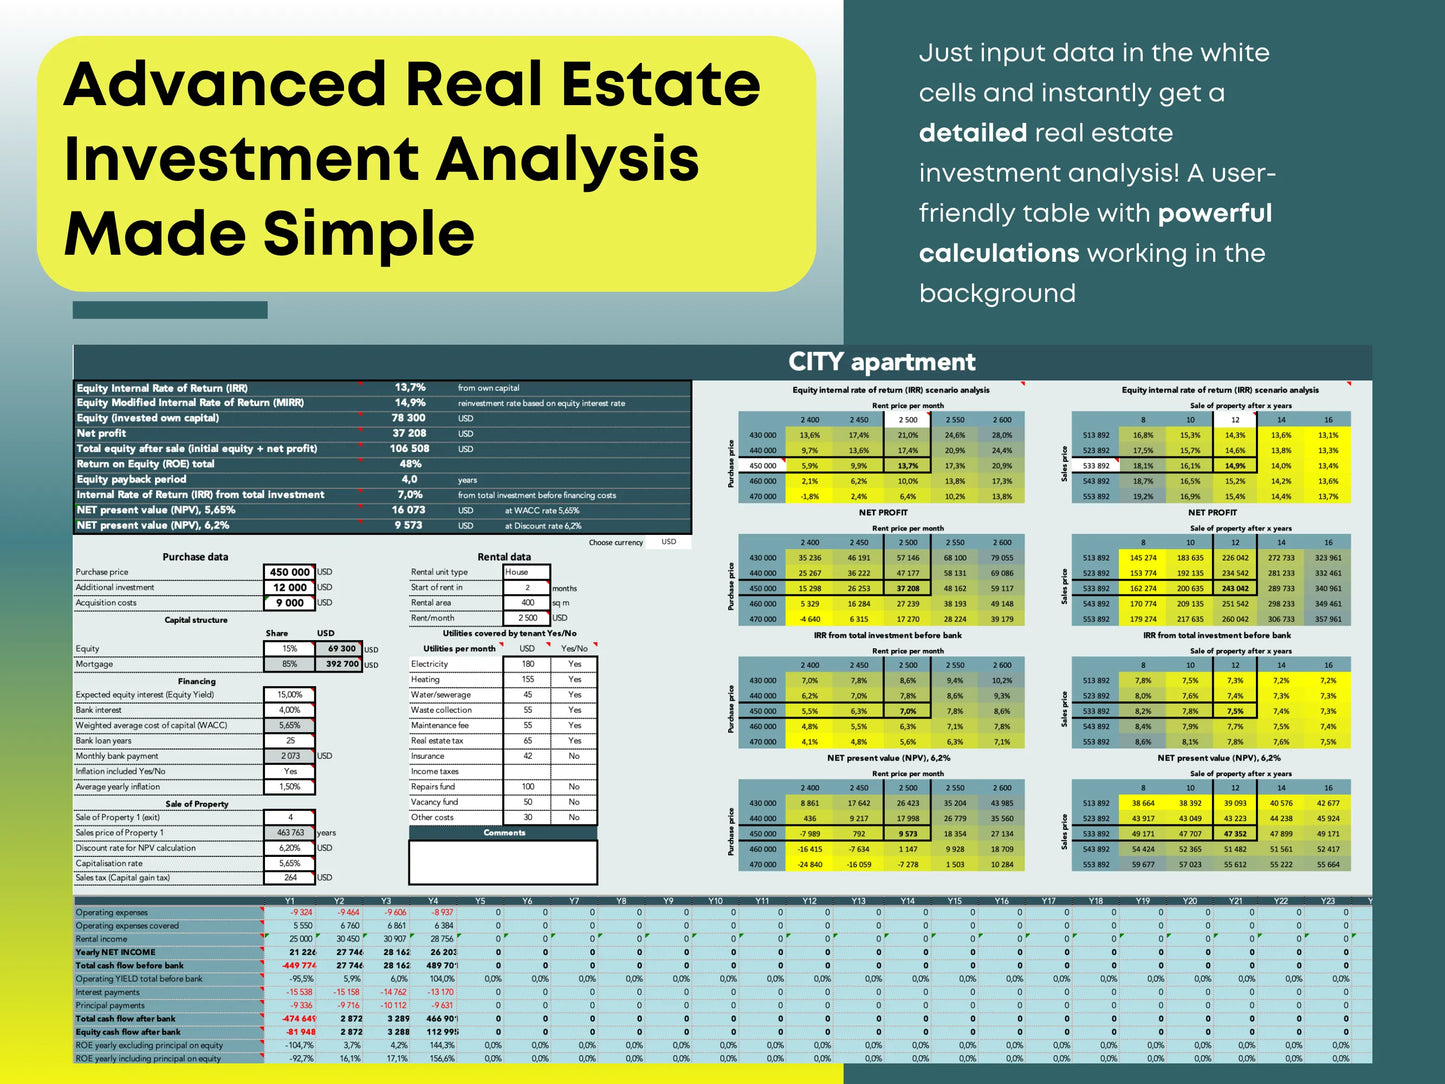
Our Real Estate Investment Analysis Spreadsheet integrates all these metrics automatically. You can:
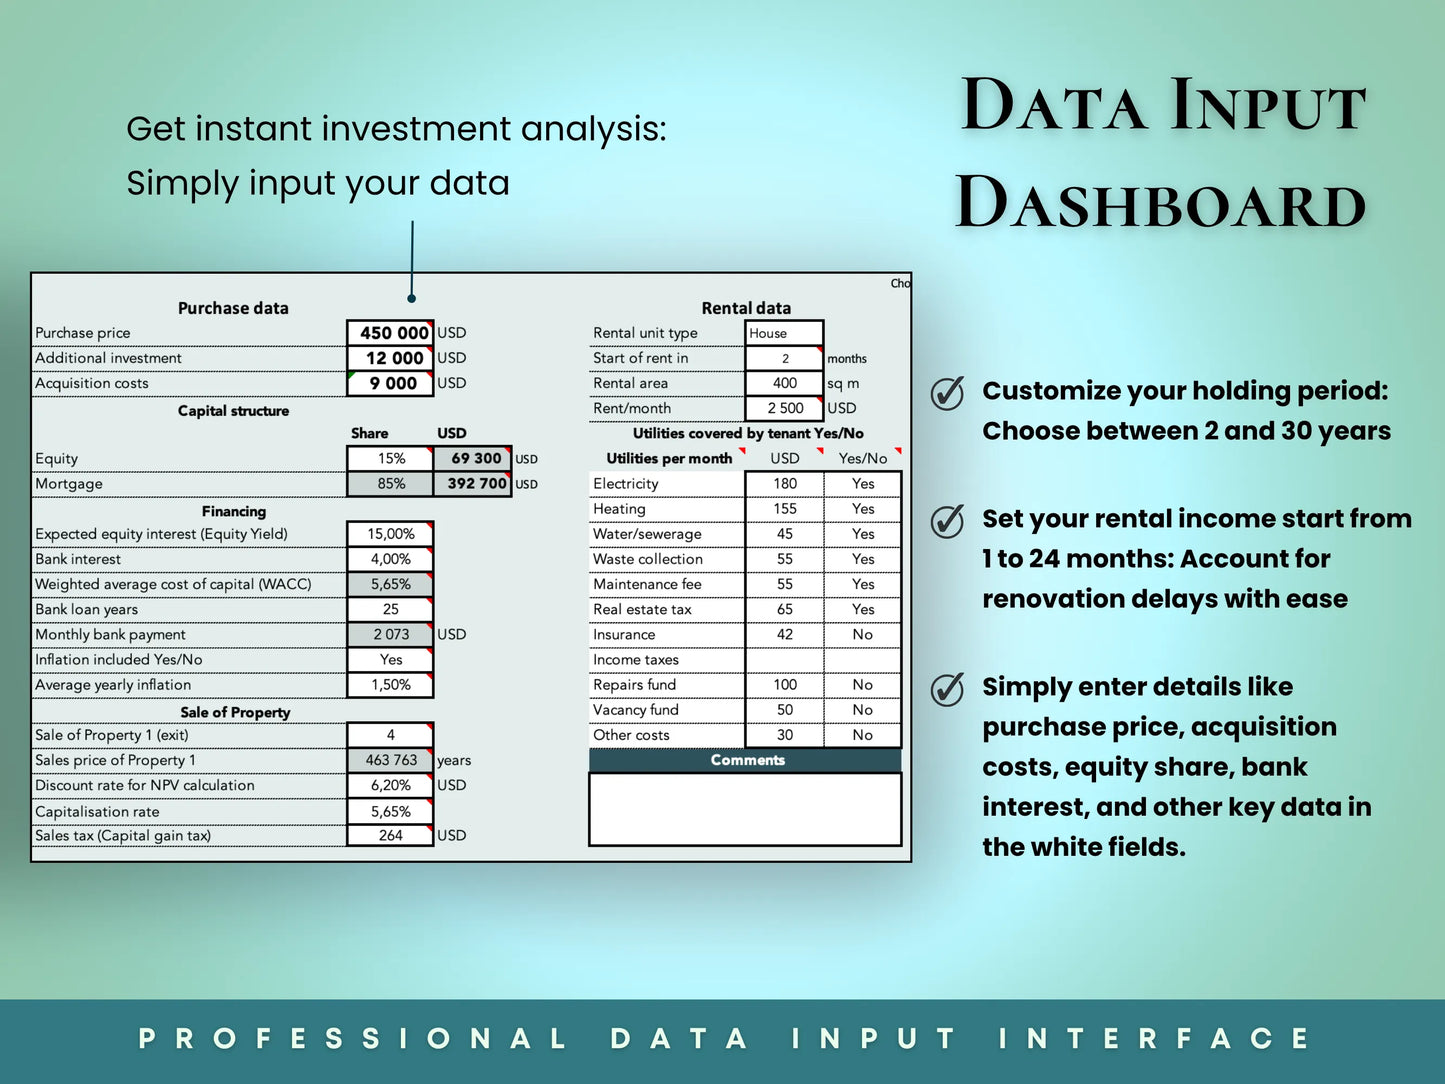
- Enter property purchase costs, mortgage details, rent income, and expenses.
- See calculated IRR, MIRR, NPV, and ROE in real time.
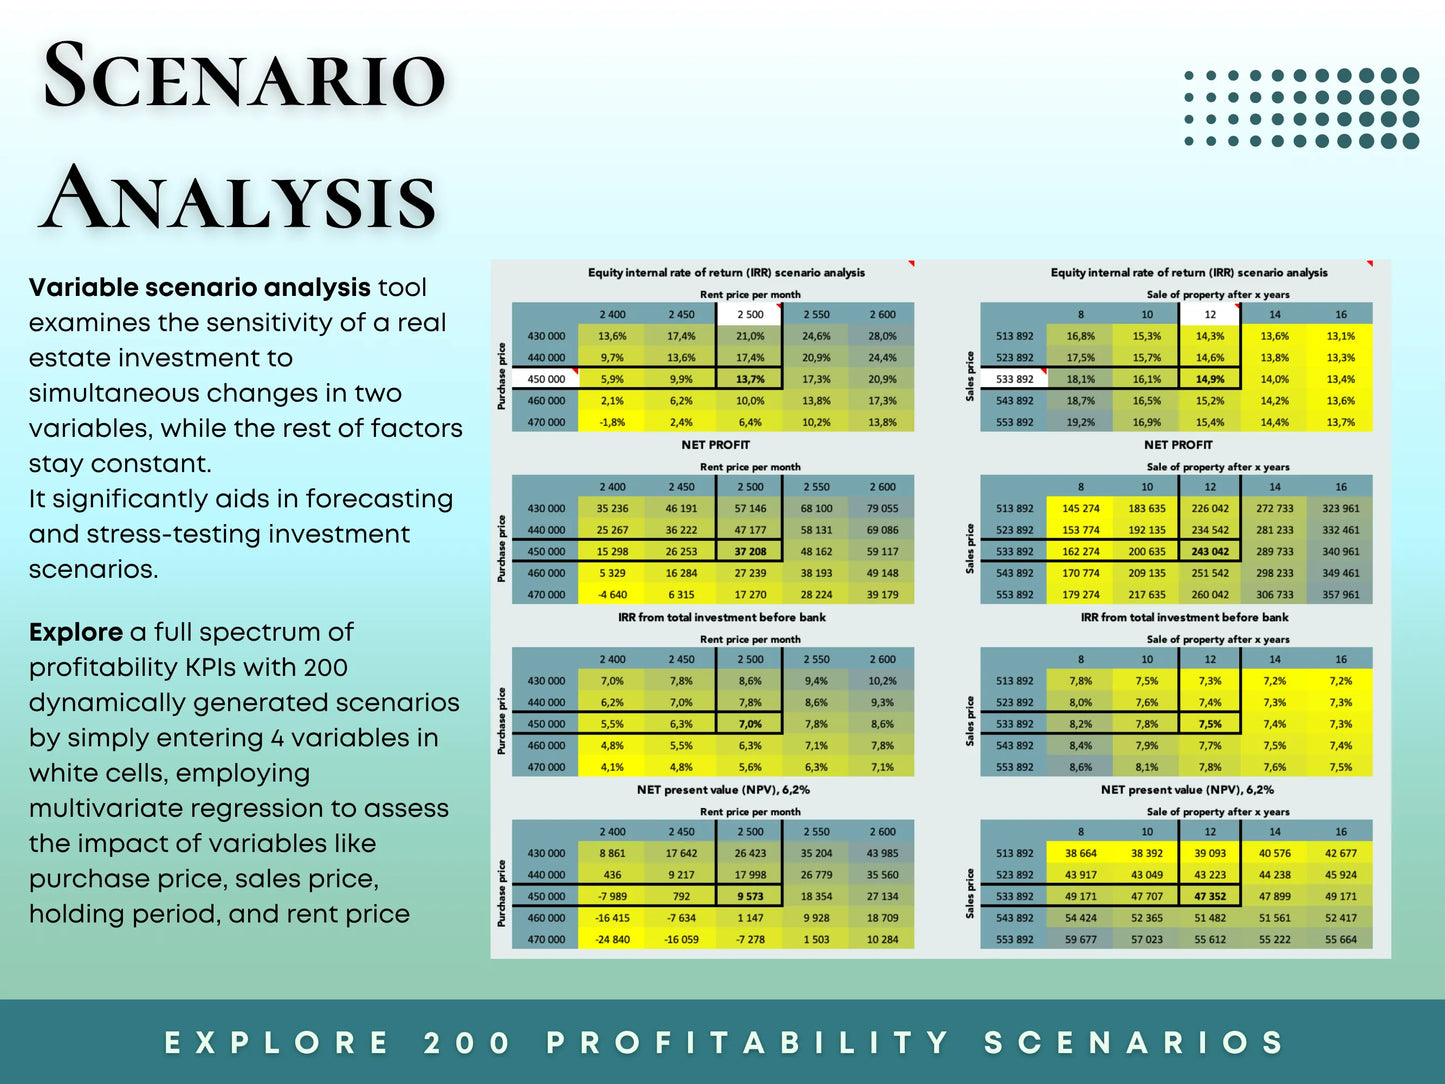
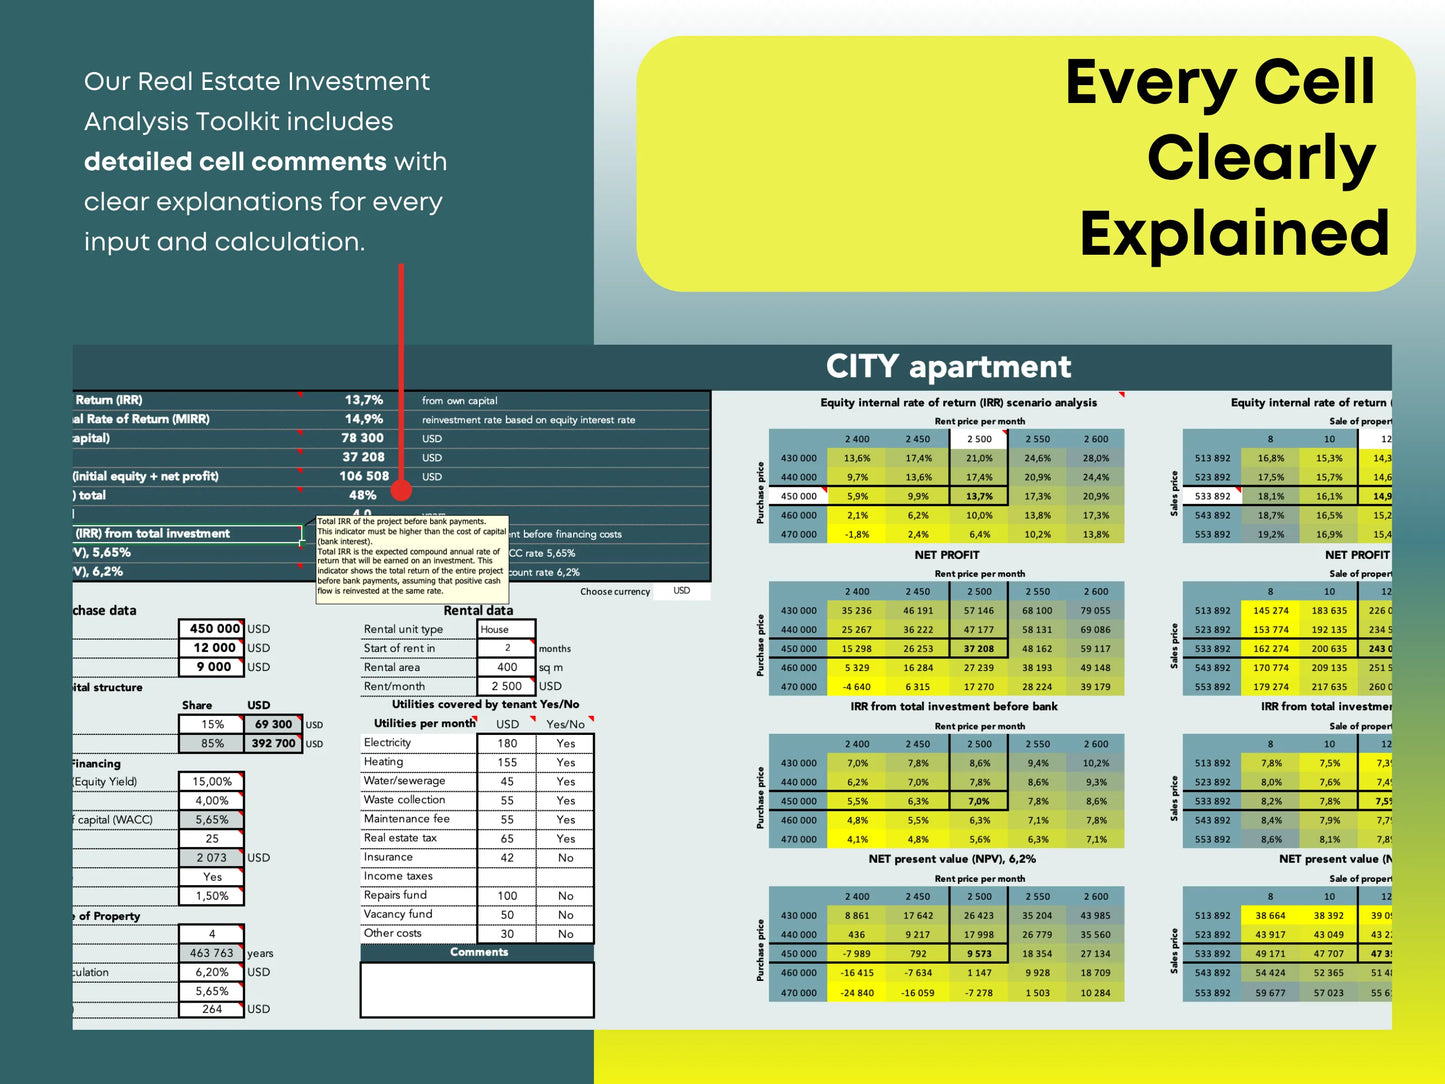
- Adjust assumptions (rent growth, interest rates, or reinvestment yield) to test sensitivity analysis and see how your returns change under different scenarios.
This data-driven approach helps you make informed, confident investment decisions — whether you’re buying a rental property, flipping a house, or analyzing multi-family assets.
8. Final Thoughts — Why These Metrics Matter for Real Estate Success
In real estate investing, intuition is not enough. Every successful investor relies on numbers — and the most critical of those are IRR, NPV, ROE, and WACC.
They help you determine:
- Whether your property is financially viable.
- How long it will take to recover your investment.
- Whether your returns justify the risk and financing costs.
By using our real estate investment calculator, you can bring transparency and precision to your decision-making process. With just a few inputs, you’ll know if your next property will truly build wealth — or drain it.