ROI vs ROE in Real Estate: Why Return on Equity Reveals the True Investment Performance
Share
ROI vs ROE in Real Estate: Why Return on Equity Shows the Real Investment Performance
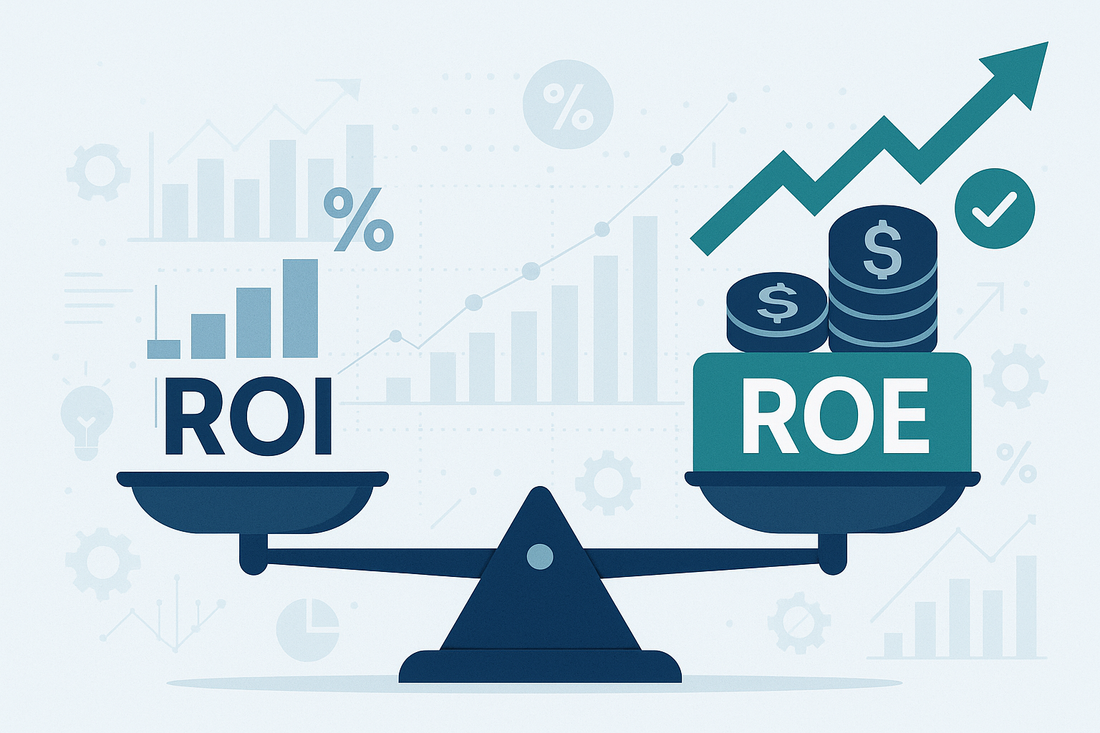
When evaluating real estate deals, most investors focus on ROI (Return on Investment) as their main measure of profitability. While ROI is useful, it doesn’t always show the full picture—especially when financing and leverage are involved.
That’s where ROE (Return on Equity) becomes essential. ROE reveals how efficiently your own invested capital (equity) generates returns. It focuses on what matters most—the performance of your money, not the bank’s.
Whether you’re using a rental property calculator, a real estate investment ROI calculator, or an investment property cash flow calculator in Excel, understanding the difference between ROI and ROE is key to making smarter, data-driven decisions.
What Is ROI in Real Estate?
ROI (Return on Investment) measures your total profit compared to the total investment cost.
In real estate, ROI is typically calculated as:
ROI = (Total Profit / Total Investment Cost)
That means comparing your net profit (cash flow + appreciation – costs) against the property’s purchase price and any renovation or acquisition costs.
Example Calculation
If you invest $300,000 in a property and earn $30,000 profit, your ROI is:
ROI = 30,000 ÷ 300,000 = 10%

ROI provides a quick, high-level overview of profitability. However, it ignores leverage—and most investors don’t buy properties entirely in cash. Once a mortgage or loan enters the equation, ROI alone can become misleading.
💡 Why ROI Alone Can Be Misleading
ROI assumes you paid 100% in cash, which rarely happens. Most real estate investors use financing—meaning the actual amount of your own money invested (equity) is much smaller than the total property value.
This is where ROI can undervalue your true performance.
Let’s look at an example:
|
Metric |
Property A (All Cash) |
Property B (Financed) |
|
Purchase Price |
$300,000 |
$300,000 |
|
Down Payment |
$300,000 |
$60,000 |
|
Annual Profit |
$30,000 |
$12,000 |
|
ROI |
10% |
4% |
|
ROE |
10% |
20% |

Even though the financed property has a lower ROI (4%), the investor only used $60,000 of their own capital—and earned $12,000, giving a 20% ROE.
That’s leverage in action. ROE shows how effectively your capital works for you, while ROI only looks at the total project.
📈 What Is ROE (Return on Equity)?
ROE (Return on Equity) measures how much profit you earn based on your initial invested equity, not the property’s total cost.
It’s calculated as:
ROE = Total Returns / Initial Invested Equity
Where:
- Total Returns = Cash flow + Net sale proceeds after debt payoff
- Initial Invested Equity = Down payment + Acquisition + Renovation costs (cash only)
For long-term projects, you can calculate annualized ROE:
ROE (annualized) = ((Total Returns / Initial Equity)^(1/Years)) - 1

ROE isolates how efficiently your cash generates returns after accounting for financing. It’s the most realistic performance metric for leveraged property investments.
🏗️ Why ROE Matters More Than ROI
1. Reflects True Leverage Efficiency
ROE reveals how effectively your equity performs after factoring in borrowed capital. Even if ROI seems modest, ROE might be much higher if financing terms are favorable.
2. Shows the Investor’s Perspective
ROI is project-based. ROE is investor-based. It measures profitability based on what you invested—not the lender.
3. Tracks Changing Equity Over Time
As you pay down your loan or property values appreciate, your equity changes. Monitoring ROE helps identify when your money becomes less efficient—signaling opportunities to refinance or reinvest.
4. Supports Strategic Investment Decisions
High ROE indicates capital efficiency, while low ROE can suggest that it’s time to release trapped equity or leverage differently. This insight is invaluable for active investors managing multiple properties.
🧾 Example: ROI vs ROE Calculation
|
Description |
Amount |
|
Property Price |
$250,000 |
|
Loan Amount |
$200,000 |
|
Initial Equity (Down Payment + Costs) |
$55,000 |
|
Net Cash Flow / Year |
$6,000 |
|
Sale Proceeds (After 5 Years, Net of Loan) |
$80,000 |
ROI = (Total Return $110,000 / Total Cost $250,000) = 44% over 5 years
ROE = (Total Return $110,000 / Equity $55,000) = 200% over 5 years
Annualized ROE ≈ 24.6% per year

To refine your understanding, compare Equity IRR (Internal Rate of Return) versus Project IRR. These reflect how the timing and leverage of cash flows affect overall equity performance.
🧠 Key Takeaway for Real Estate Investors
While ROI is a helpful indicator of overall project success, ROE provides a clearer picture of how effectively your money is working. It factors in leverage, financing structure, and time—making it far more useful in real-world property analysis.
In short:
- ROI → Great for comparing properties by total project profitability.
- ROE → Best for evaluating how efficiently your capital performs.
⚙️ How Our Real Estate Profitability Calculator Helps You Measure Both
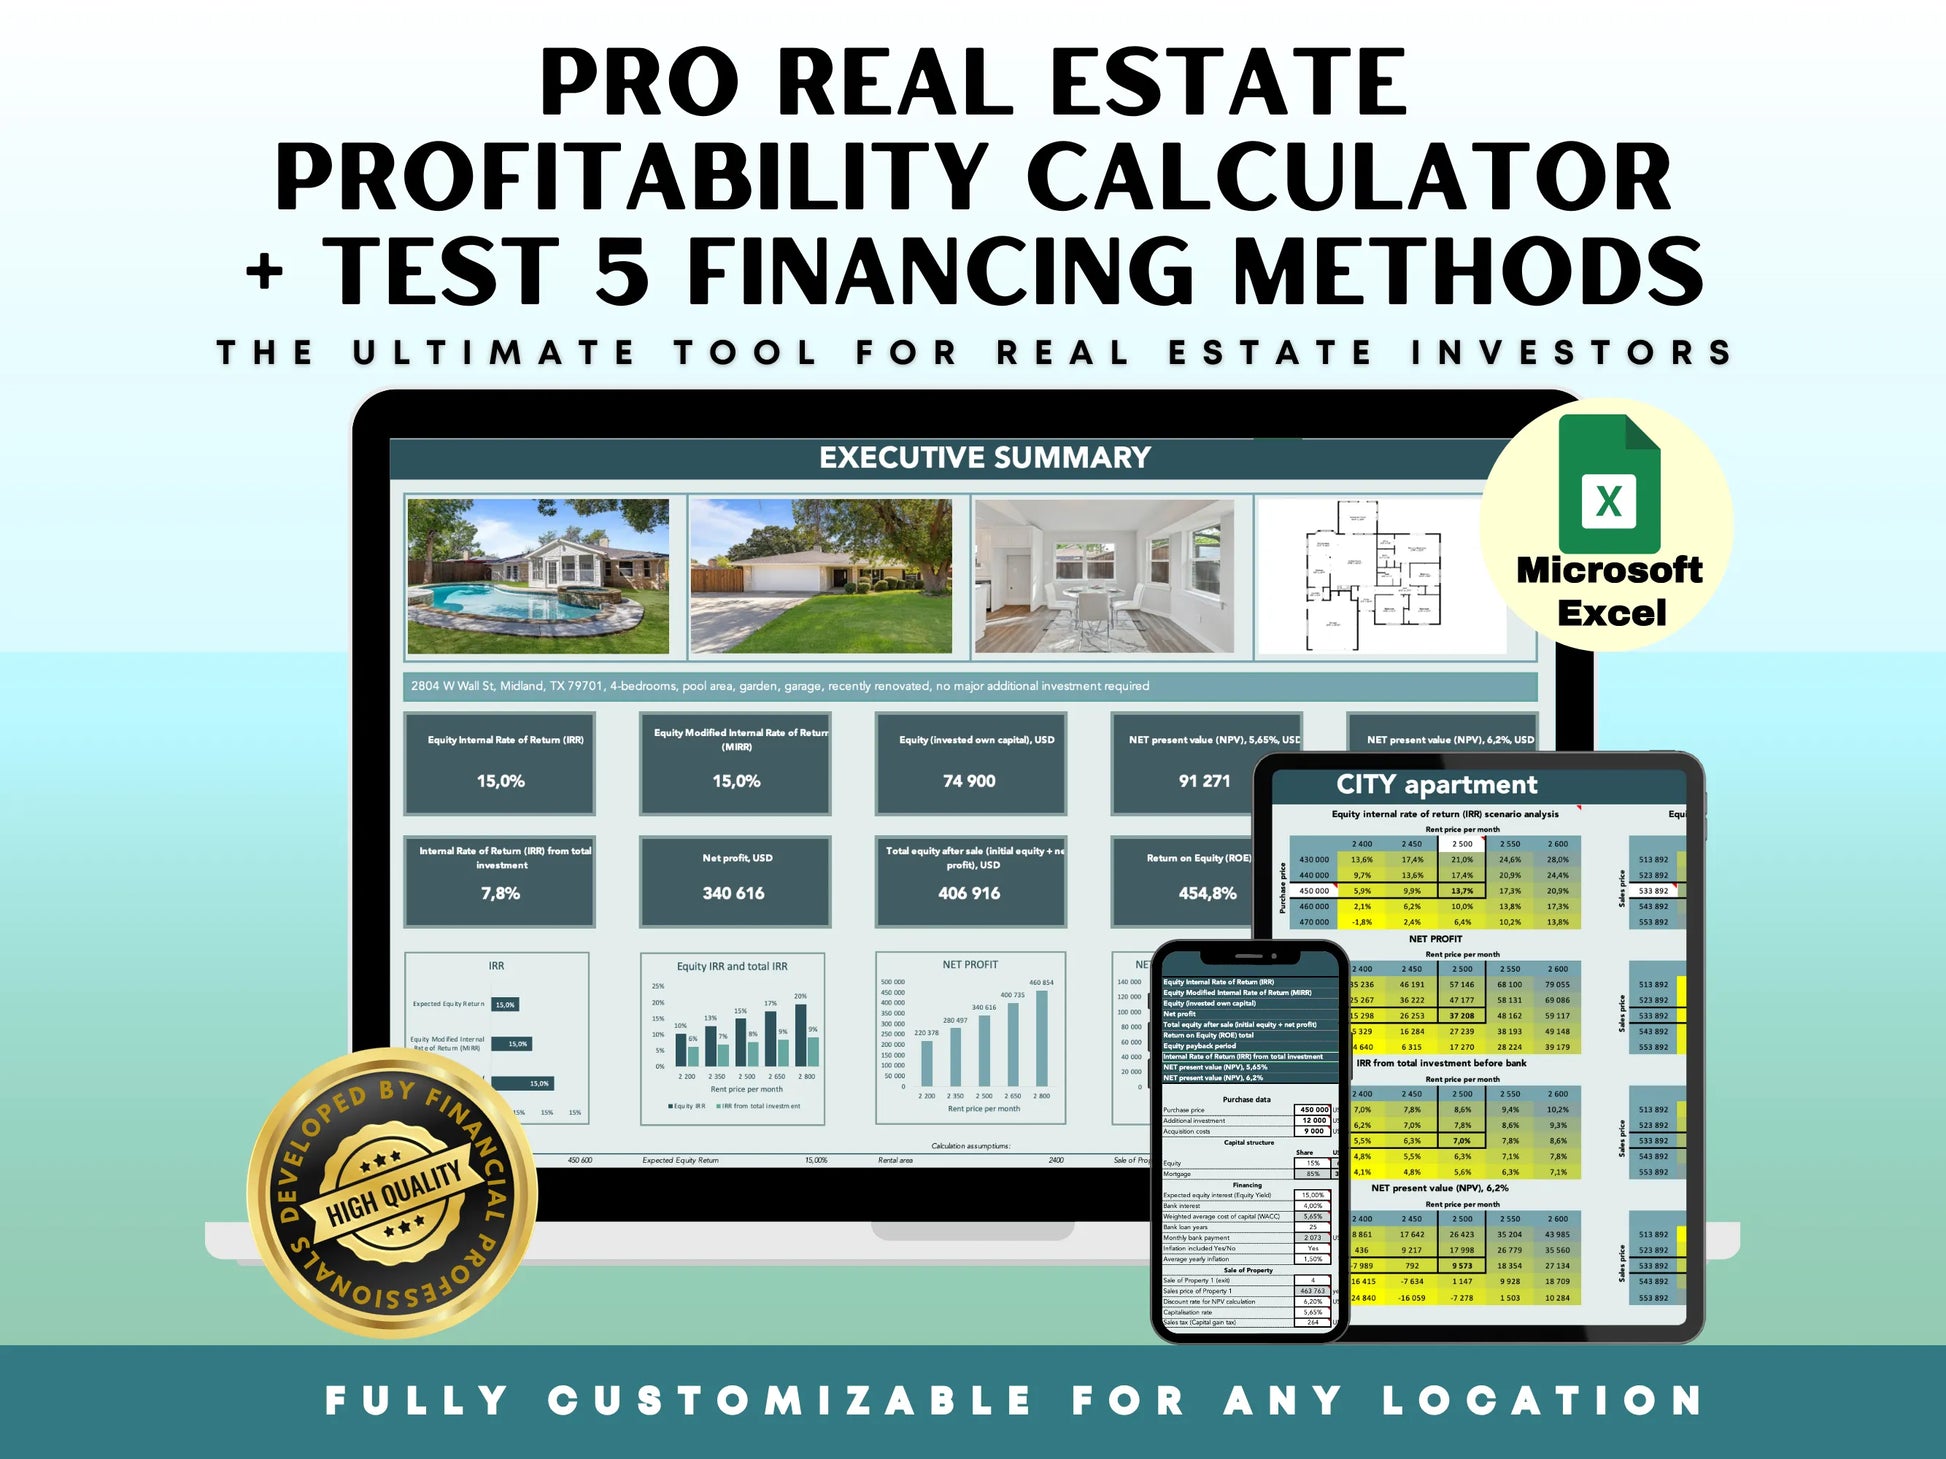
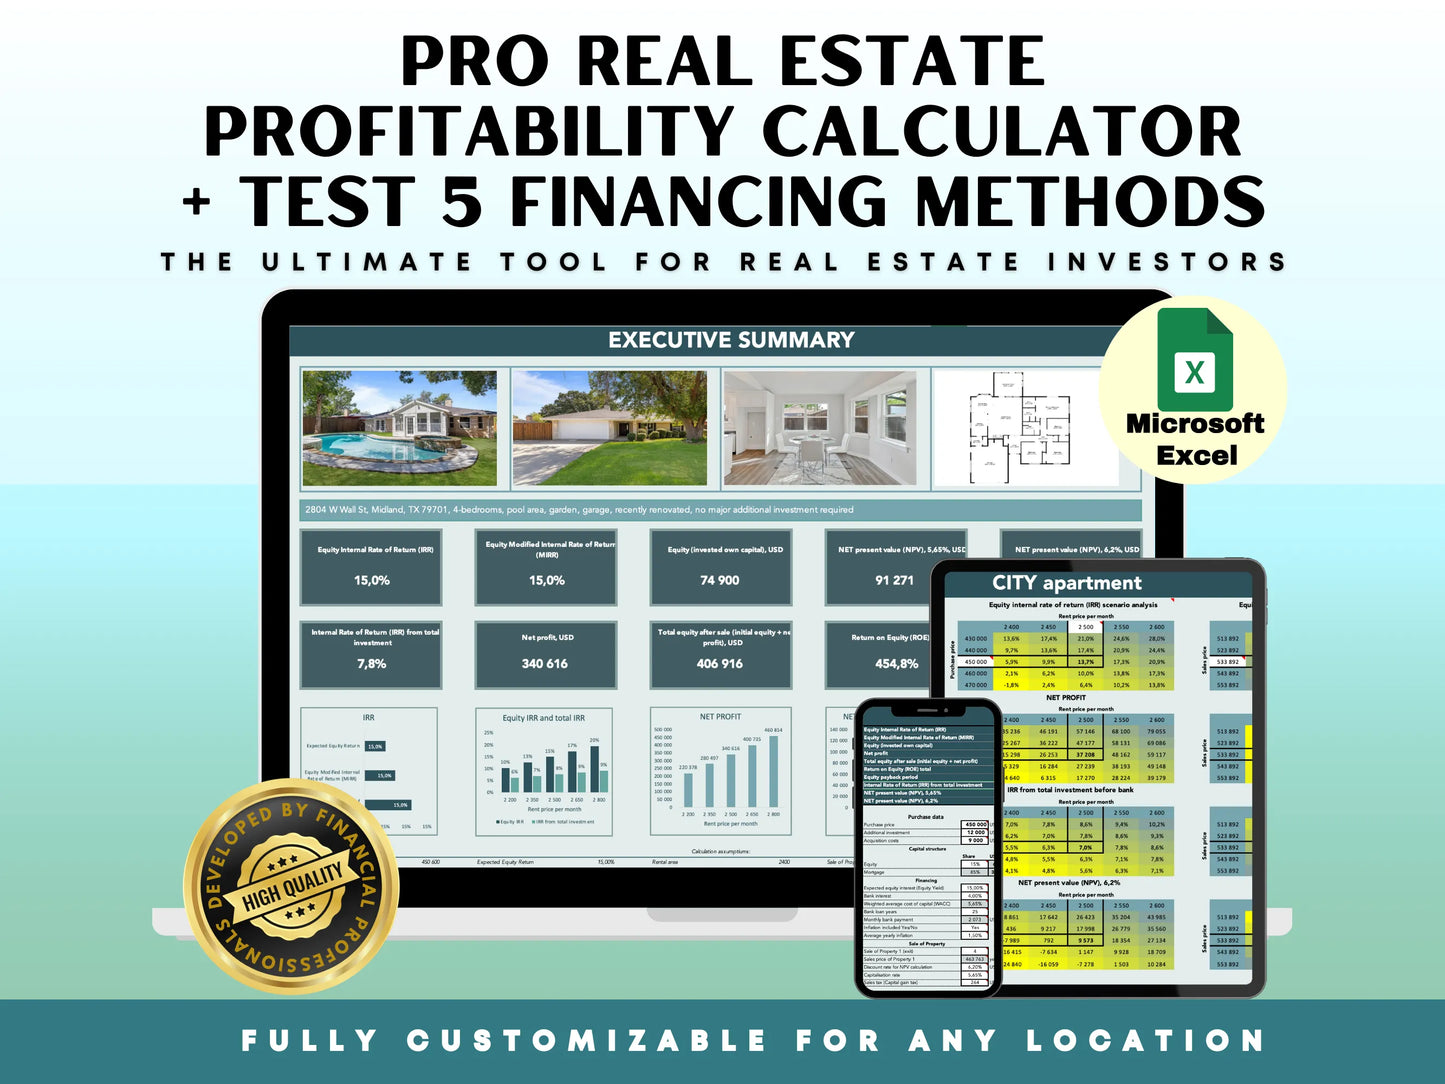
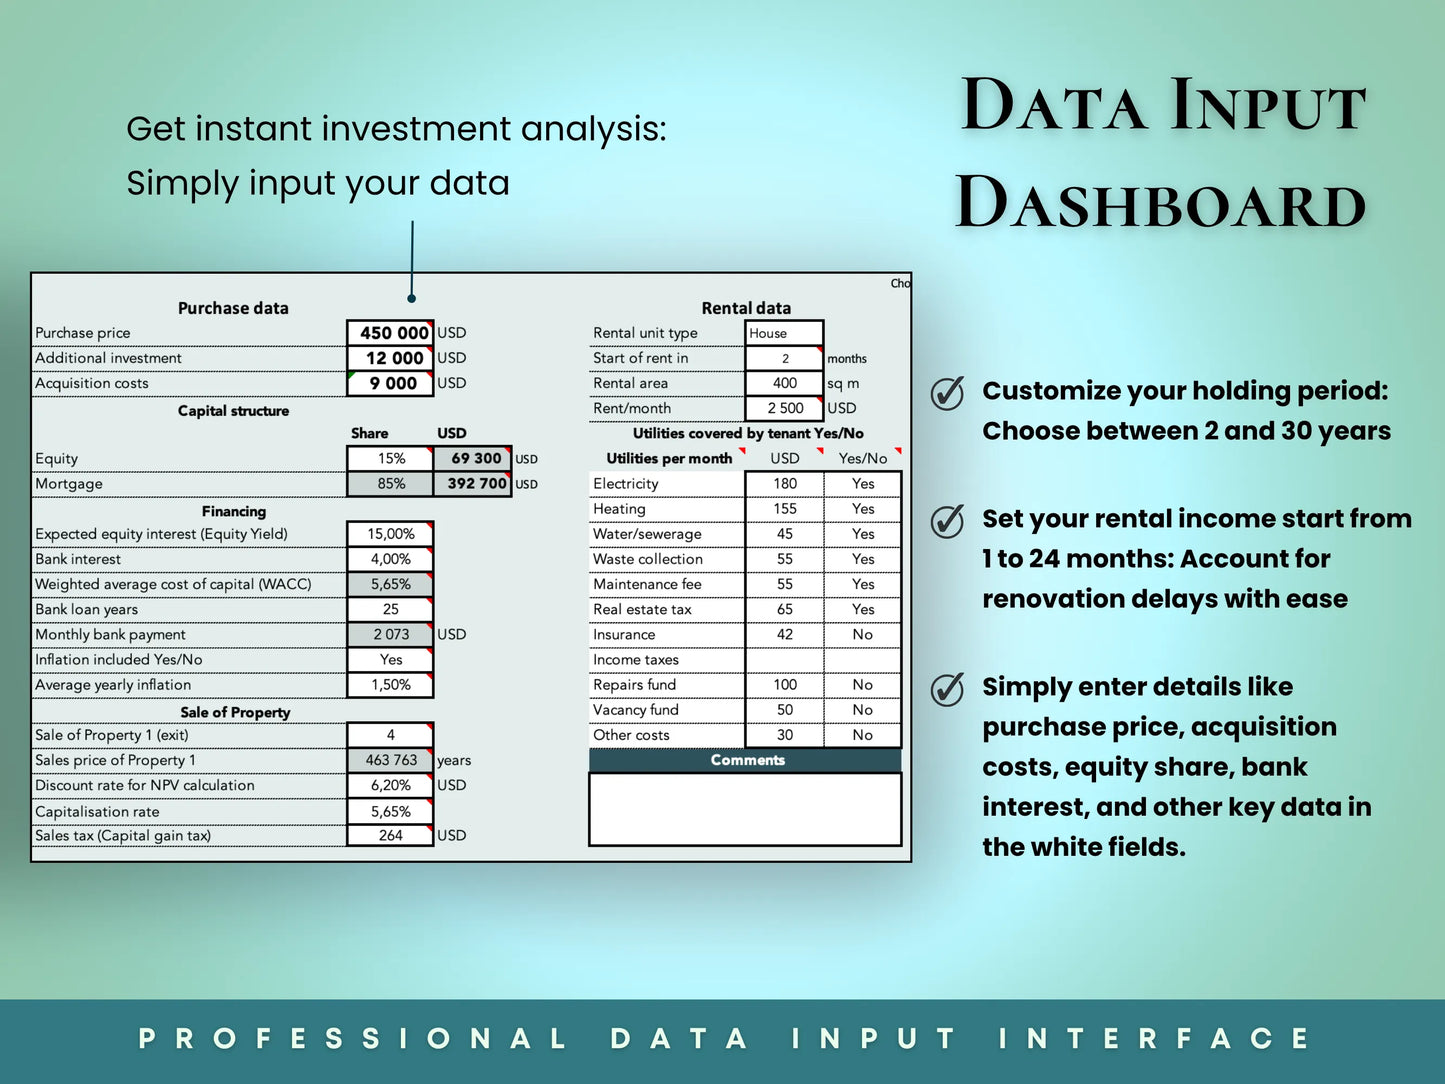
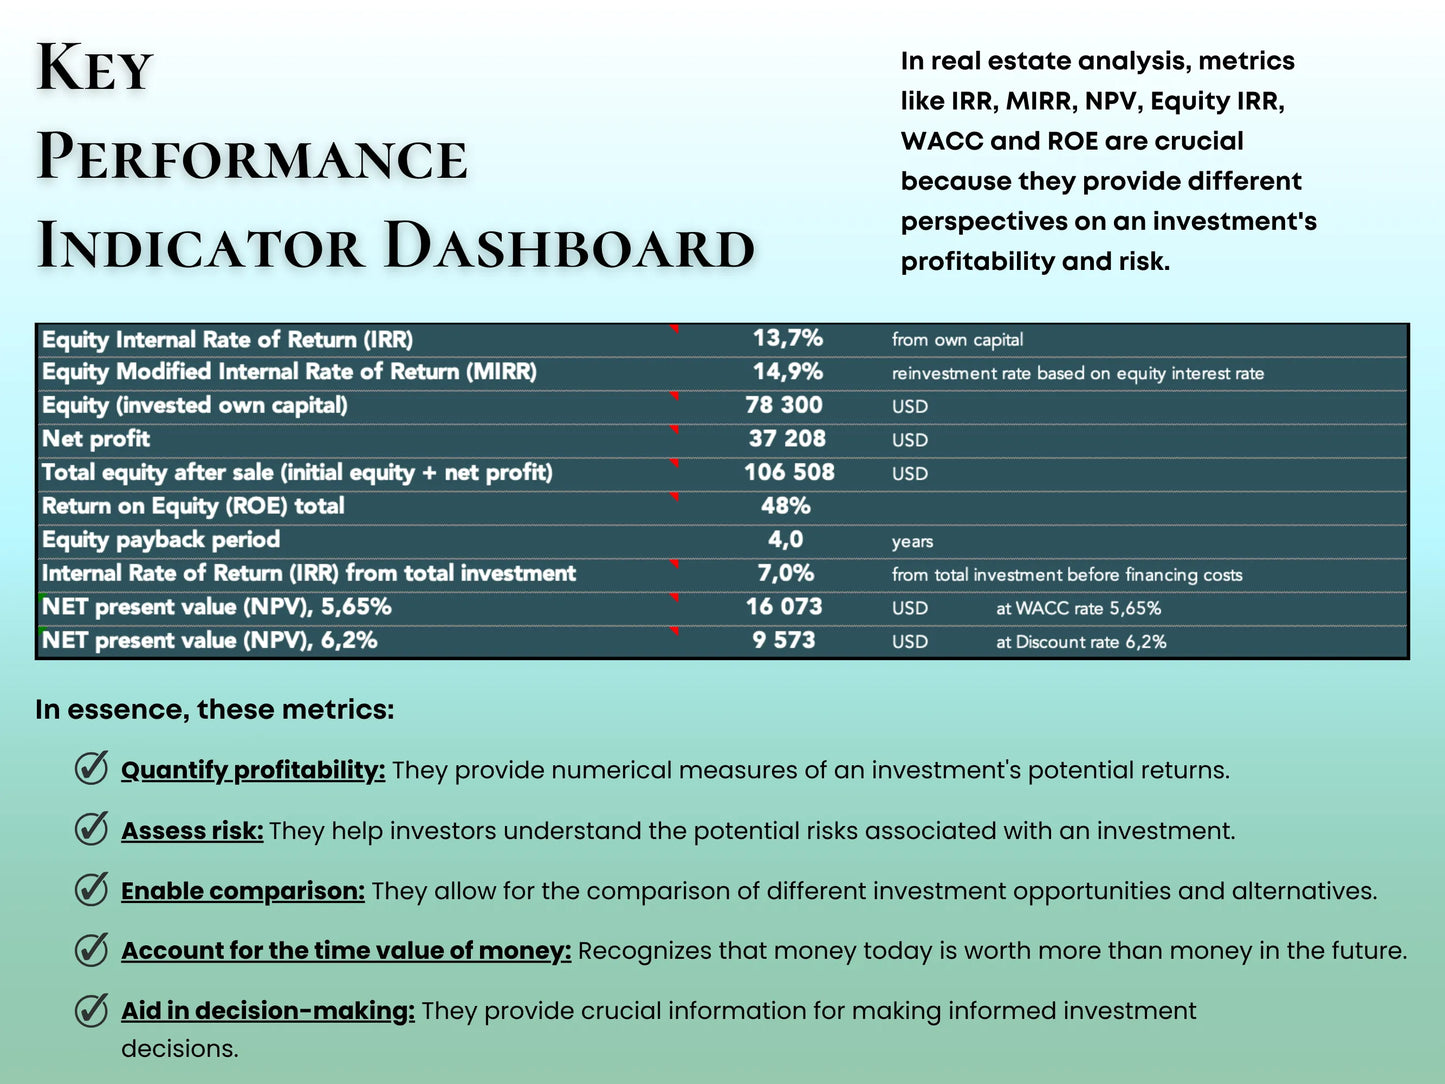
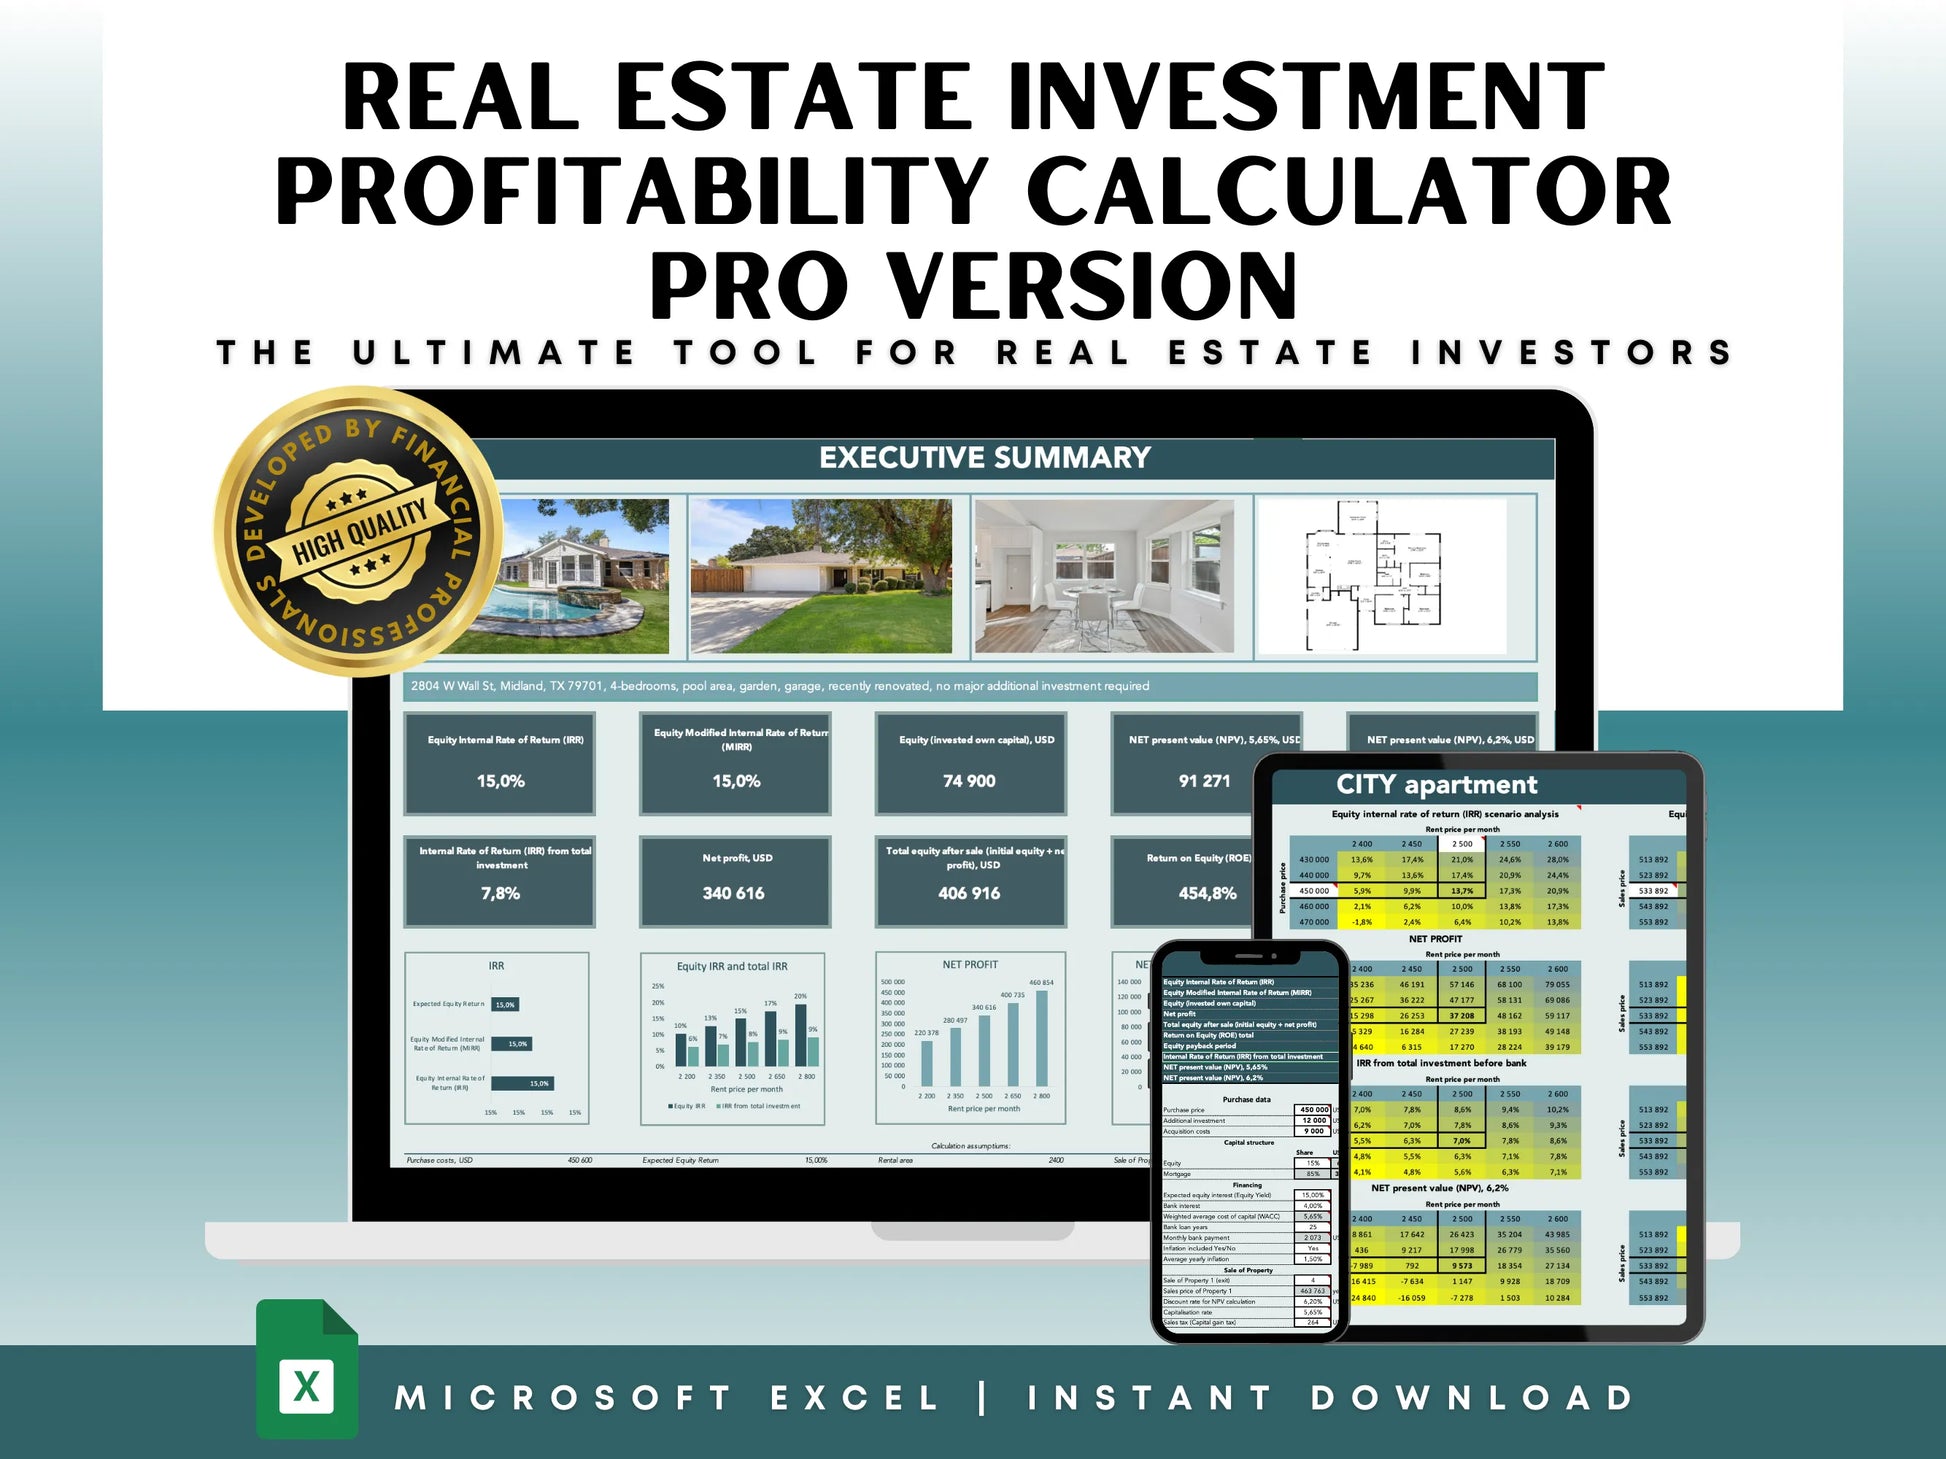
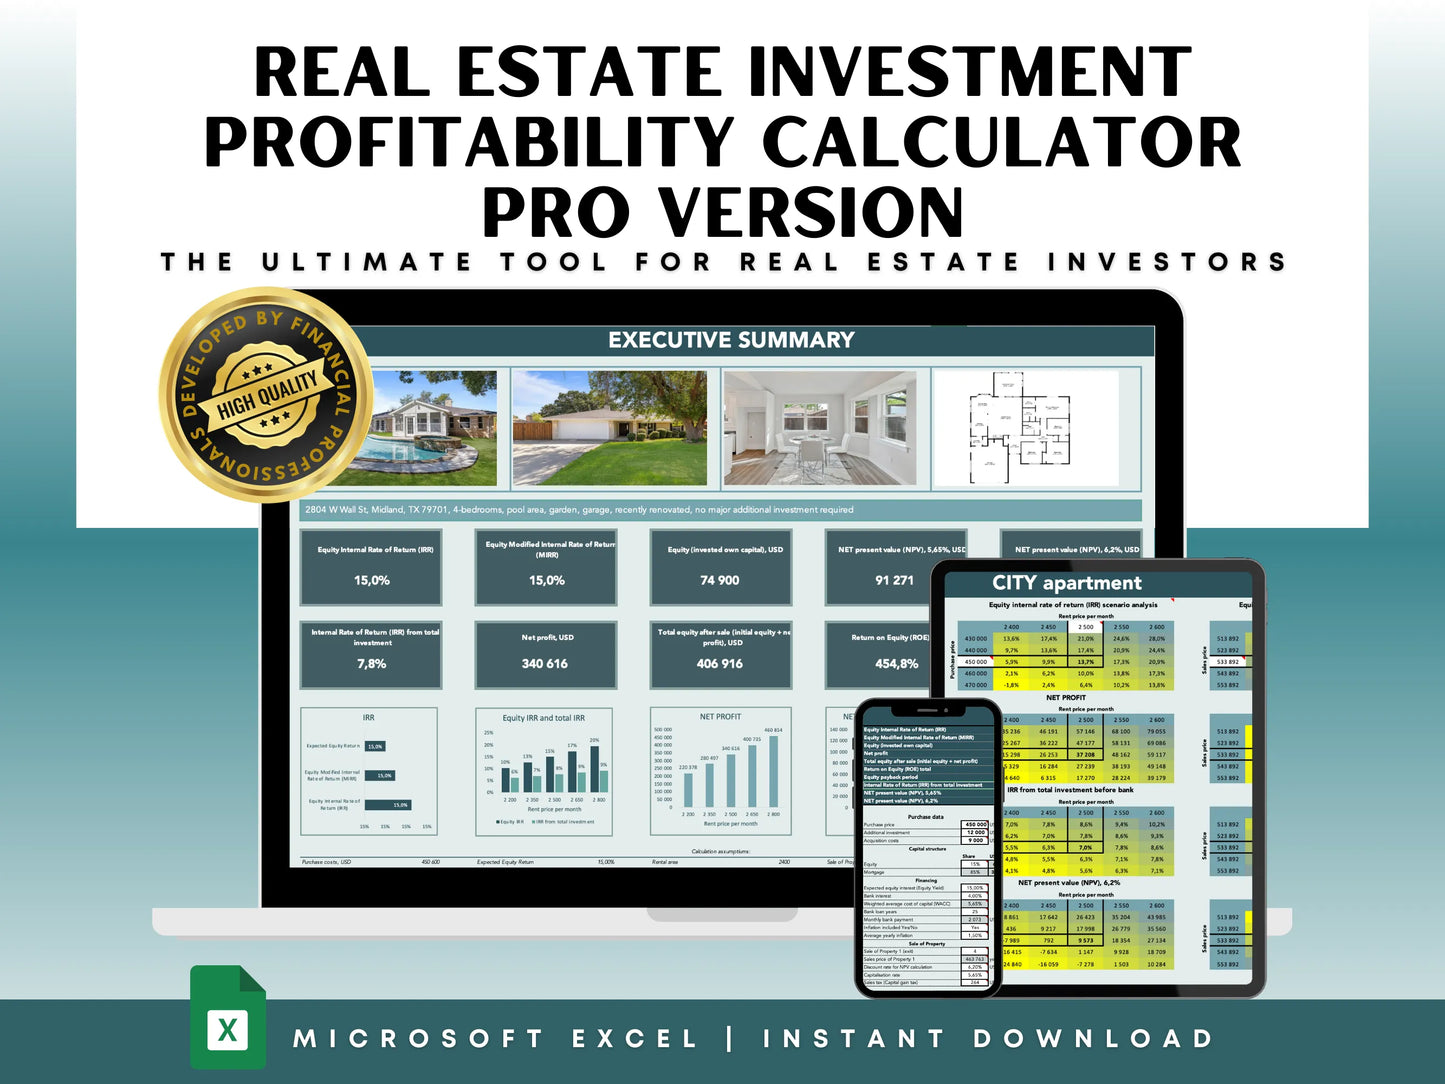
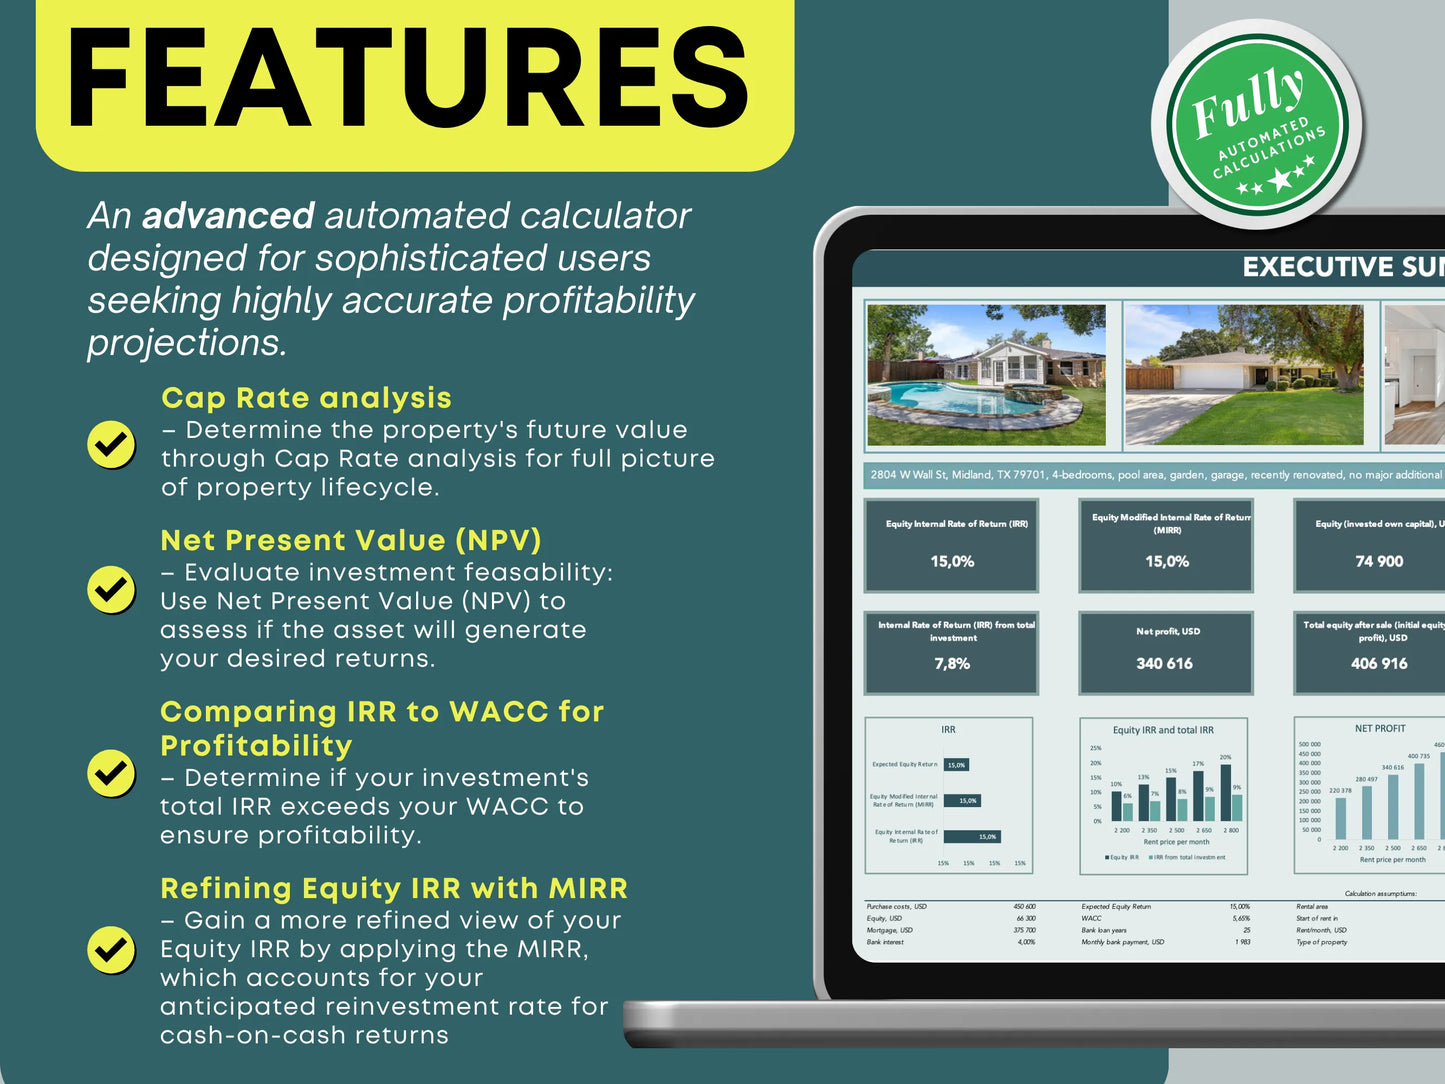
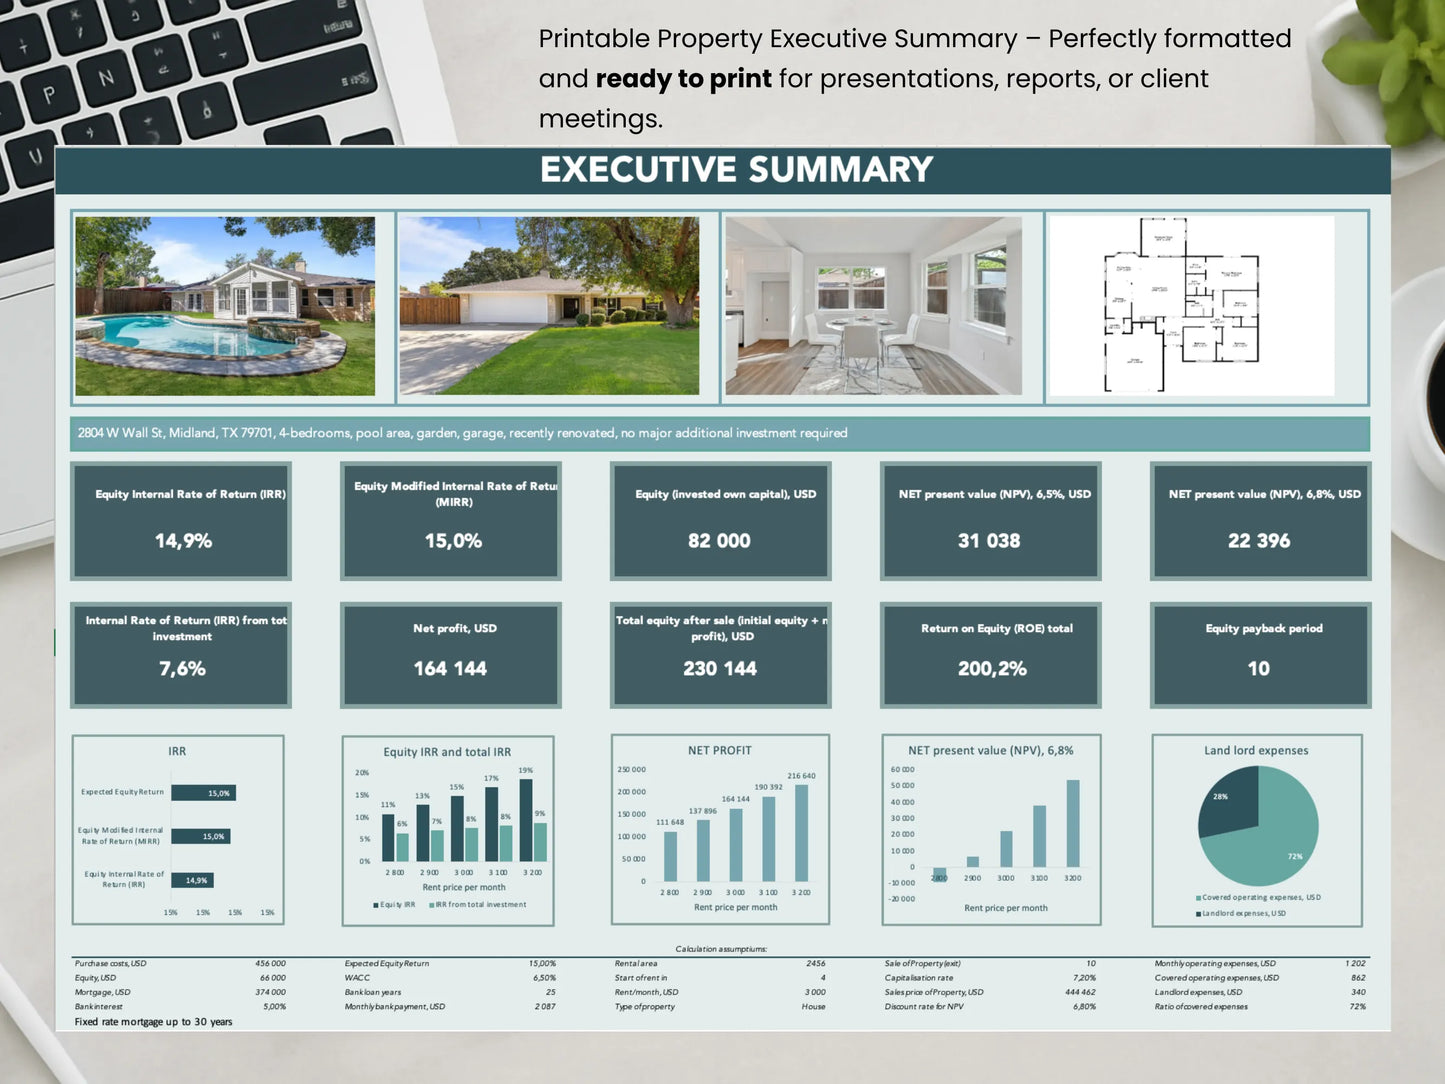
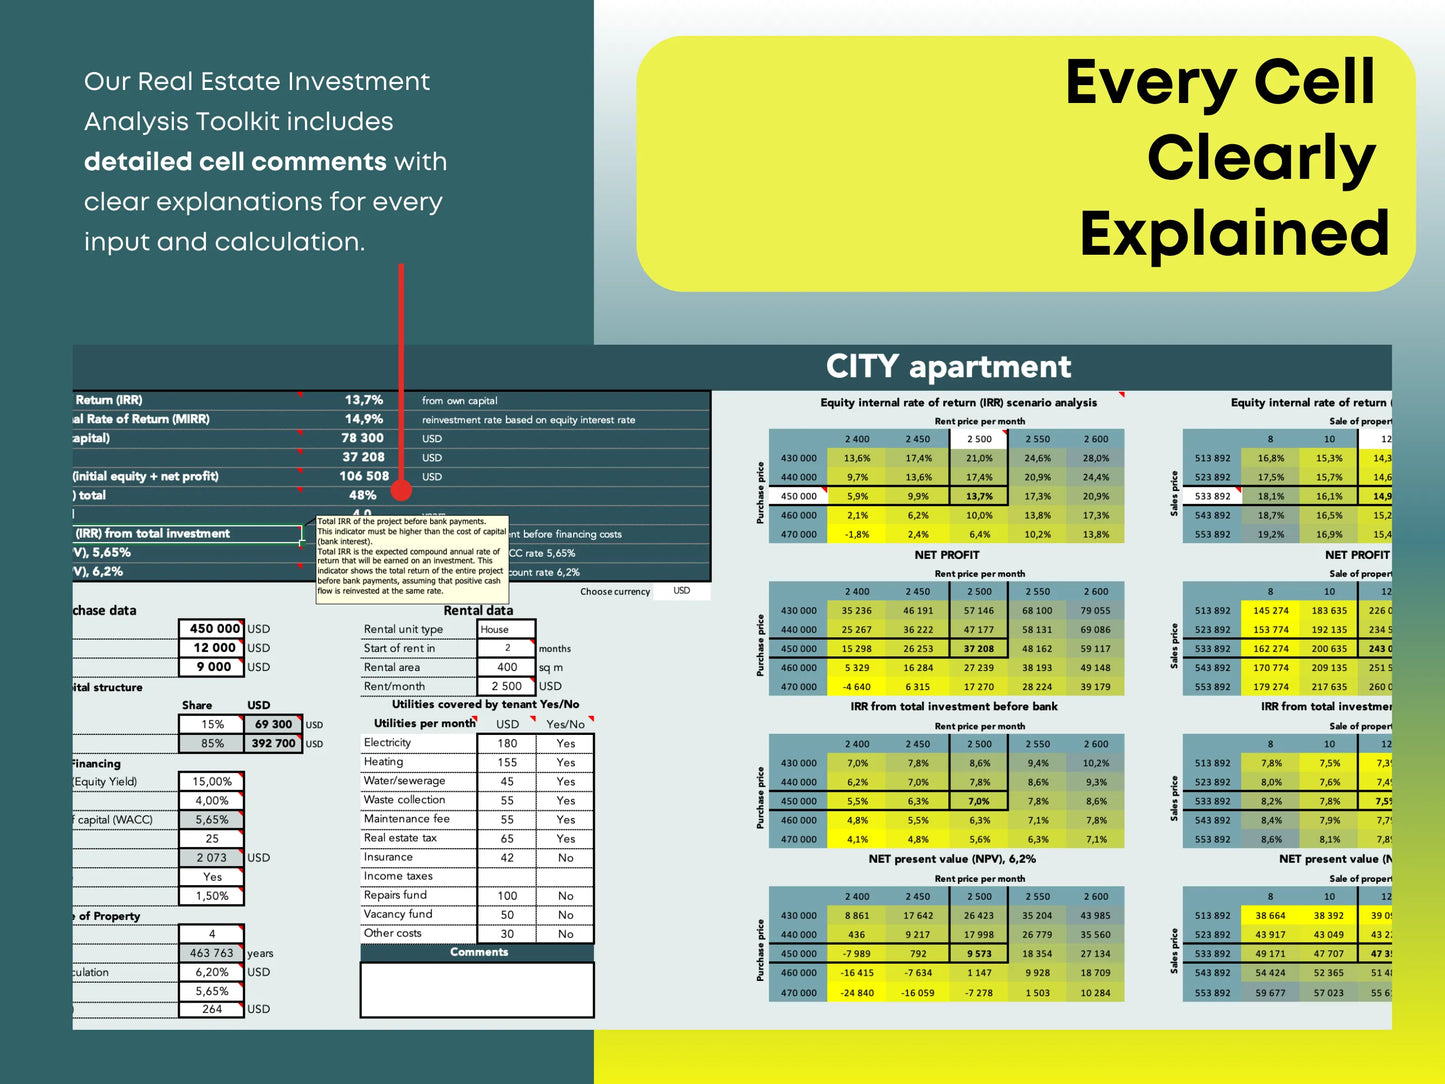
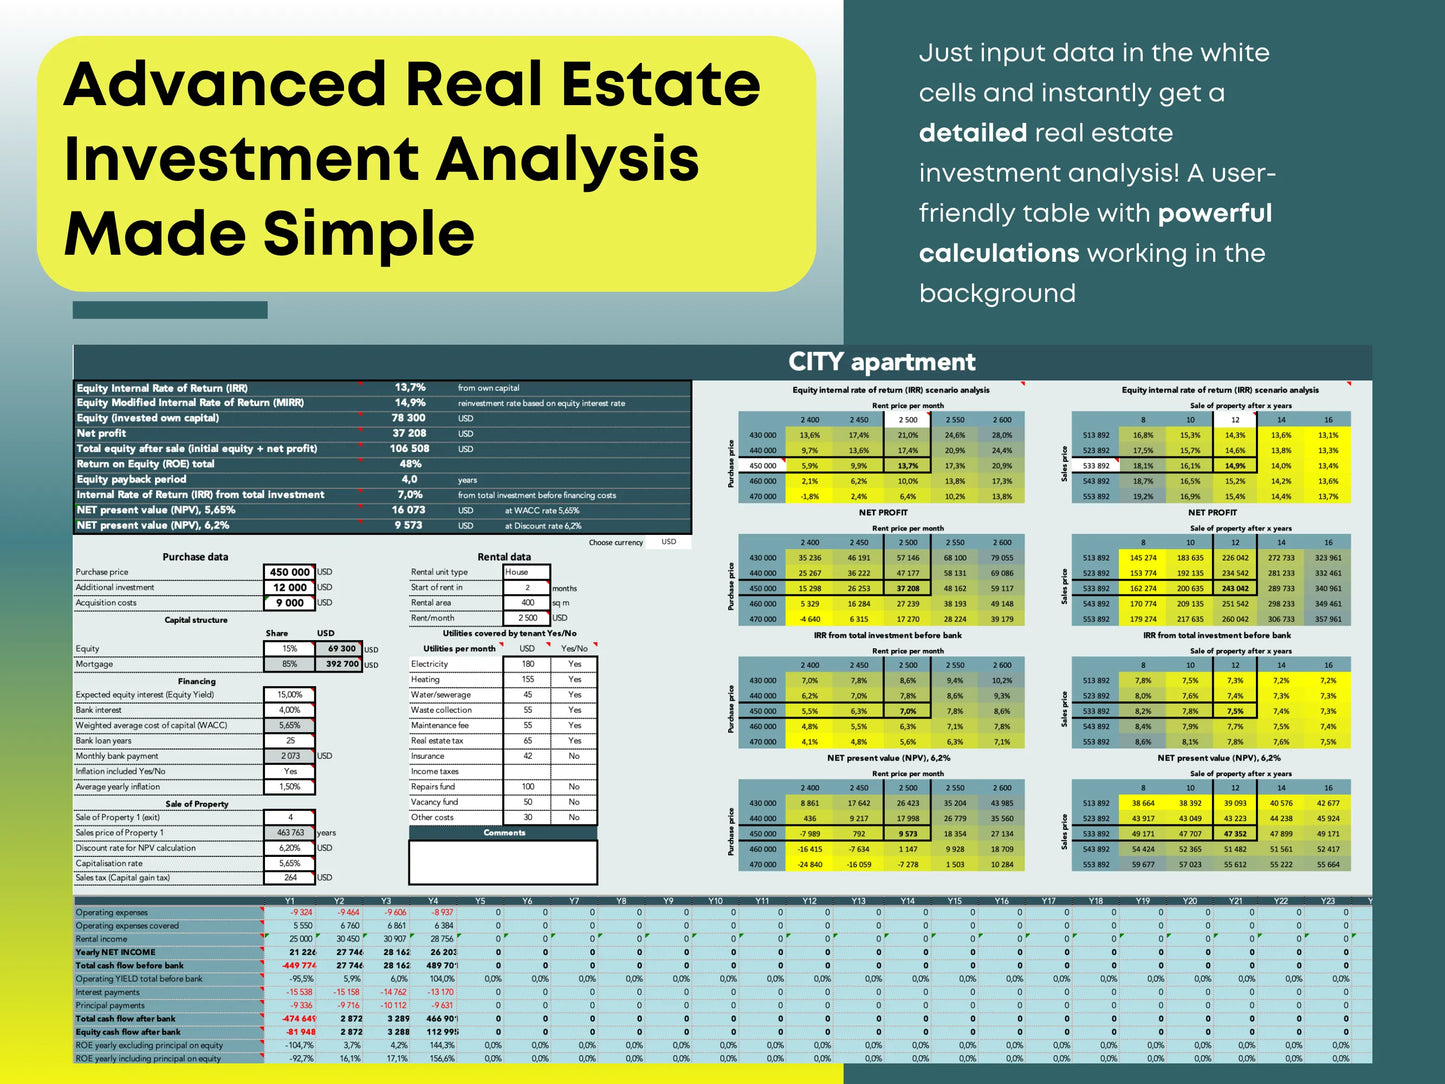
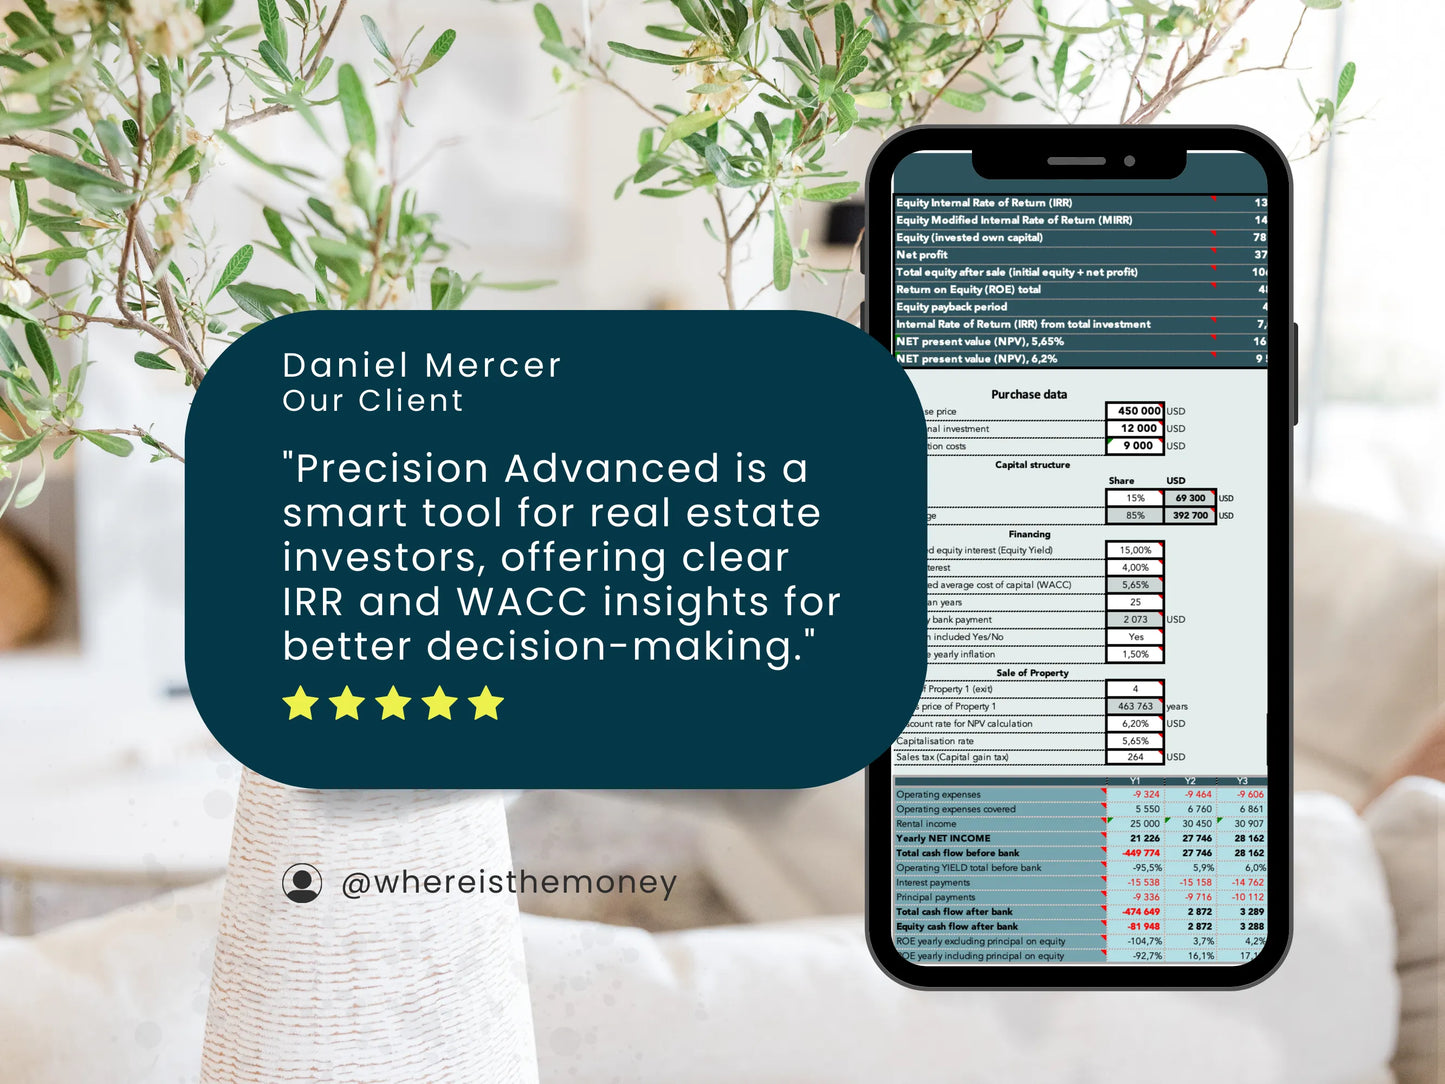
Our Real Estate Profitability Calculator (Pro Version)—available as a rental property calculator Excel template—makes analyzing these metrics simple and automated.
It includes:
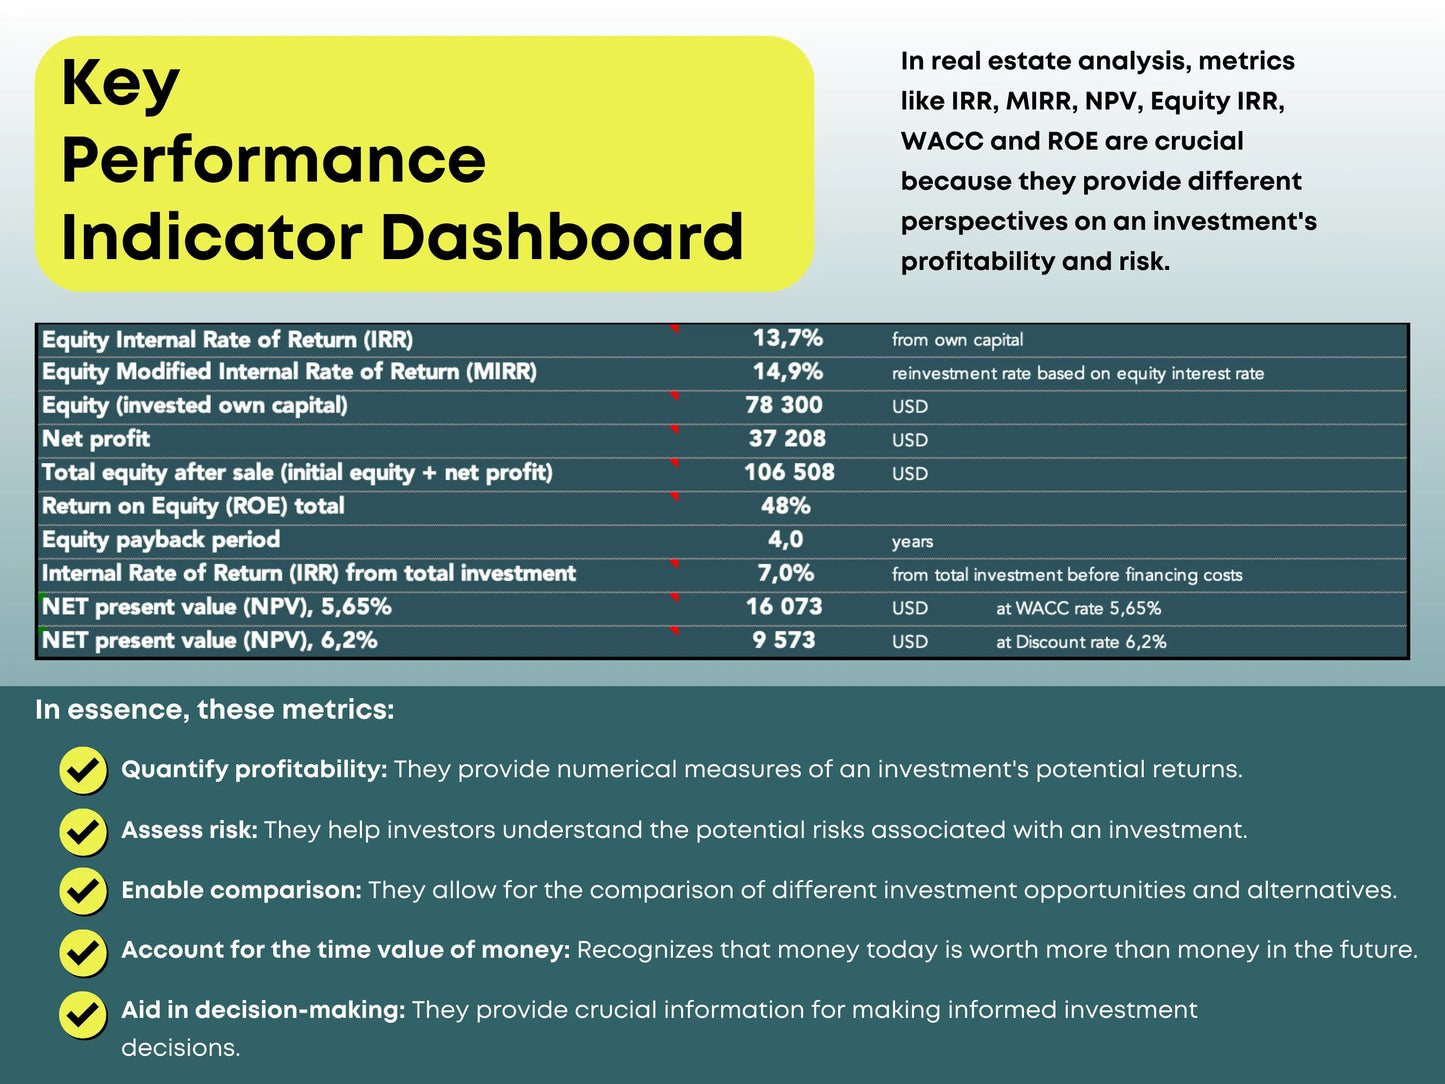
- ROI on total project cost
- ROE on initial invested equity
- IRR, NPV, and WACC calculations
- Cash flow analysis for real estate investments
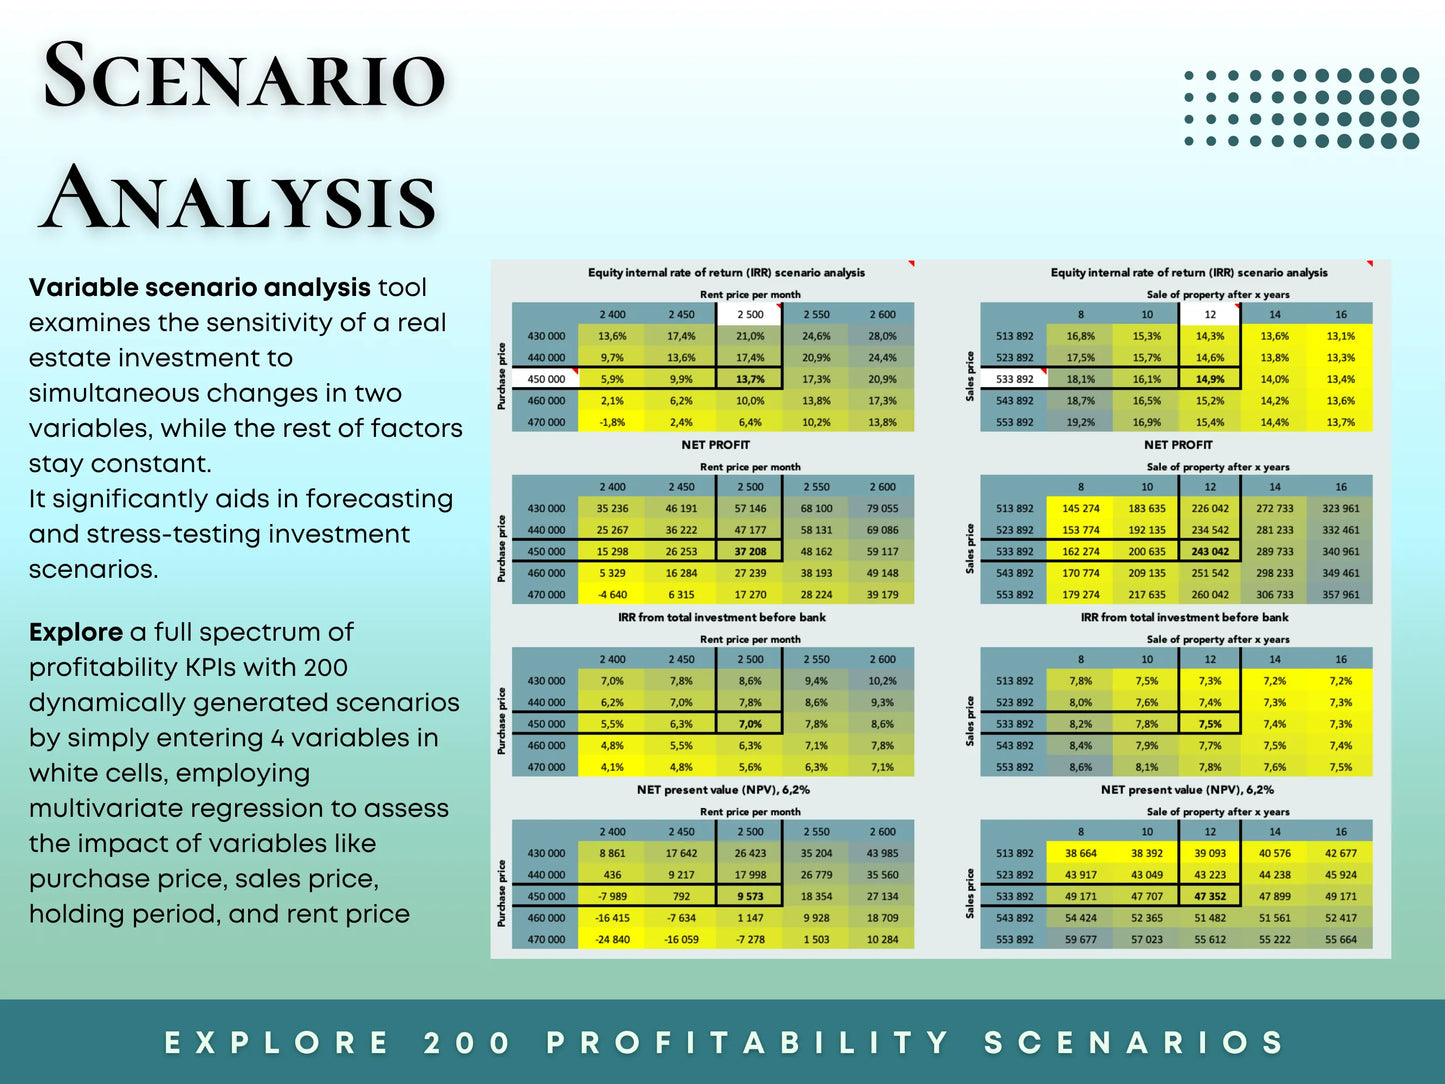
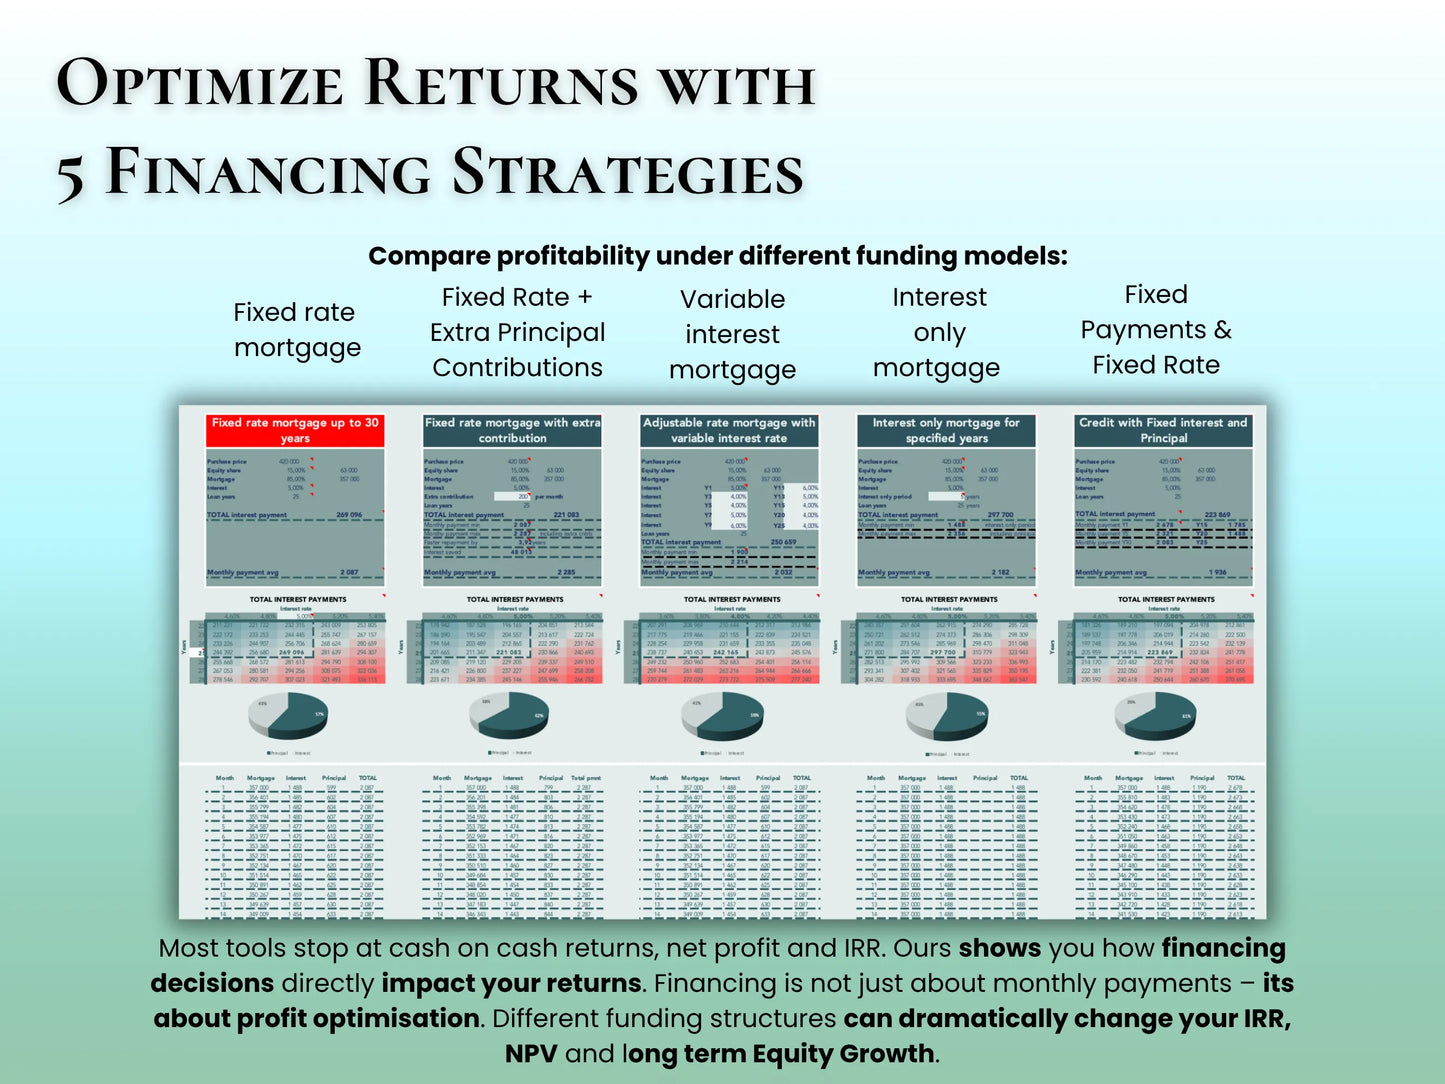
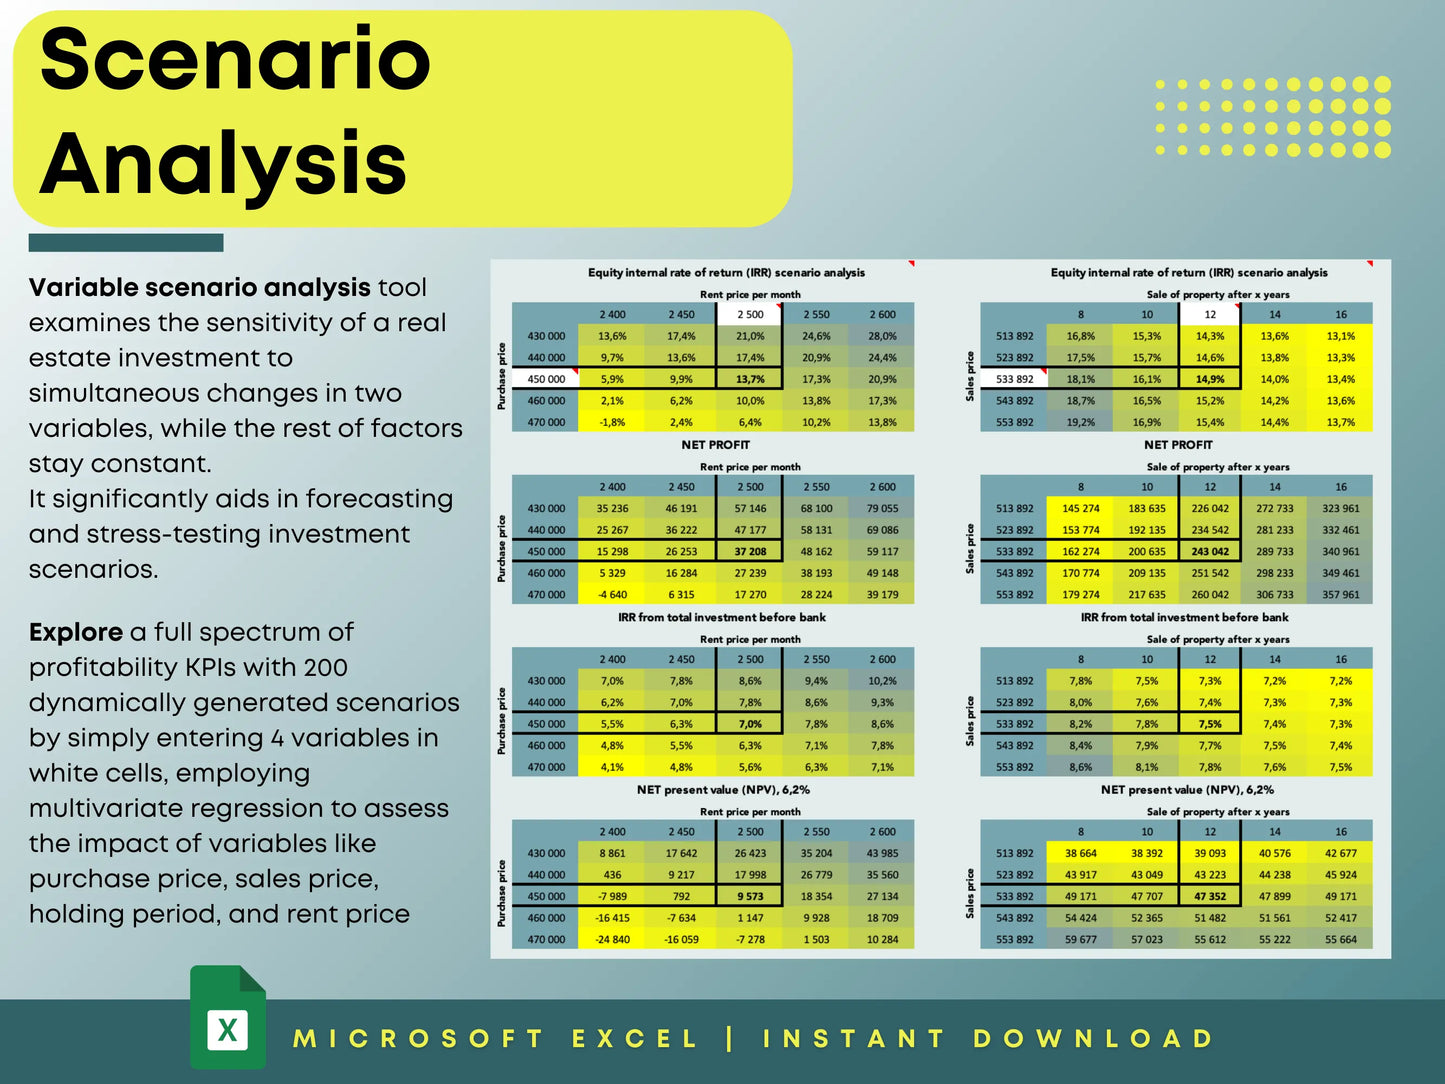
- Scenario testing with up to 5 financing methods
- Elasticity analysis for rent, expenses, and market assumptions
You can instantly test different financing strategies to see how they impact profitability and equity efficiency. The tool works seamlessly for:
- Residential and commercial real estate
- Rental property estimators
- Investment property ROI spreadsheets
This gives you clear, professional results—perfect for investors, agents, and analysts.
📊 Advantages of Using Our ROE-Focused Model
- Instant, clear profitability insights – View ROI, ROE, and IRR at a glance.
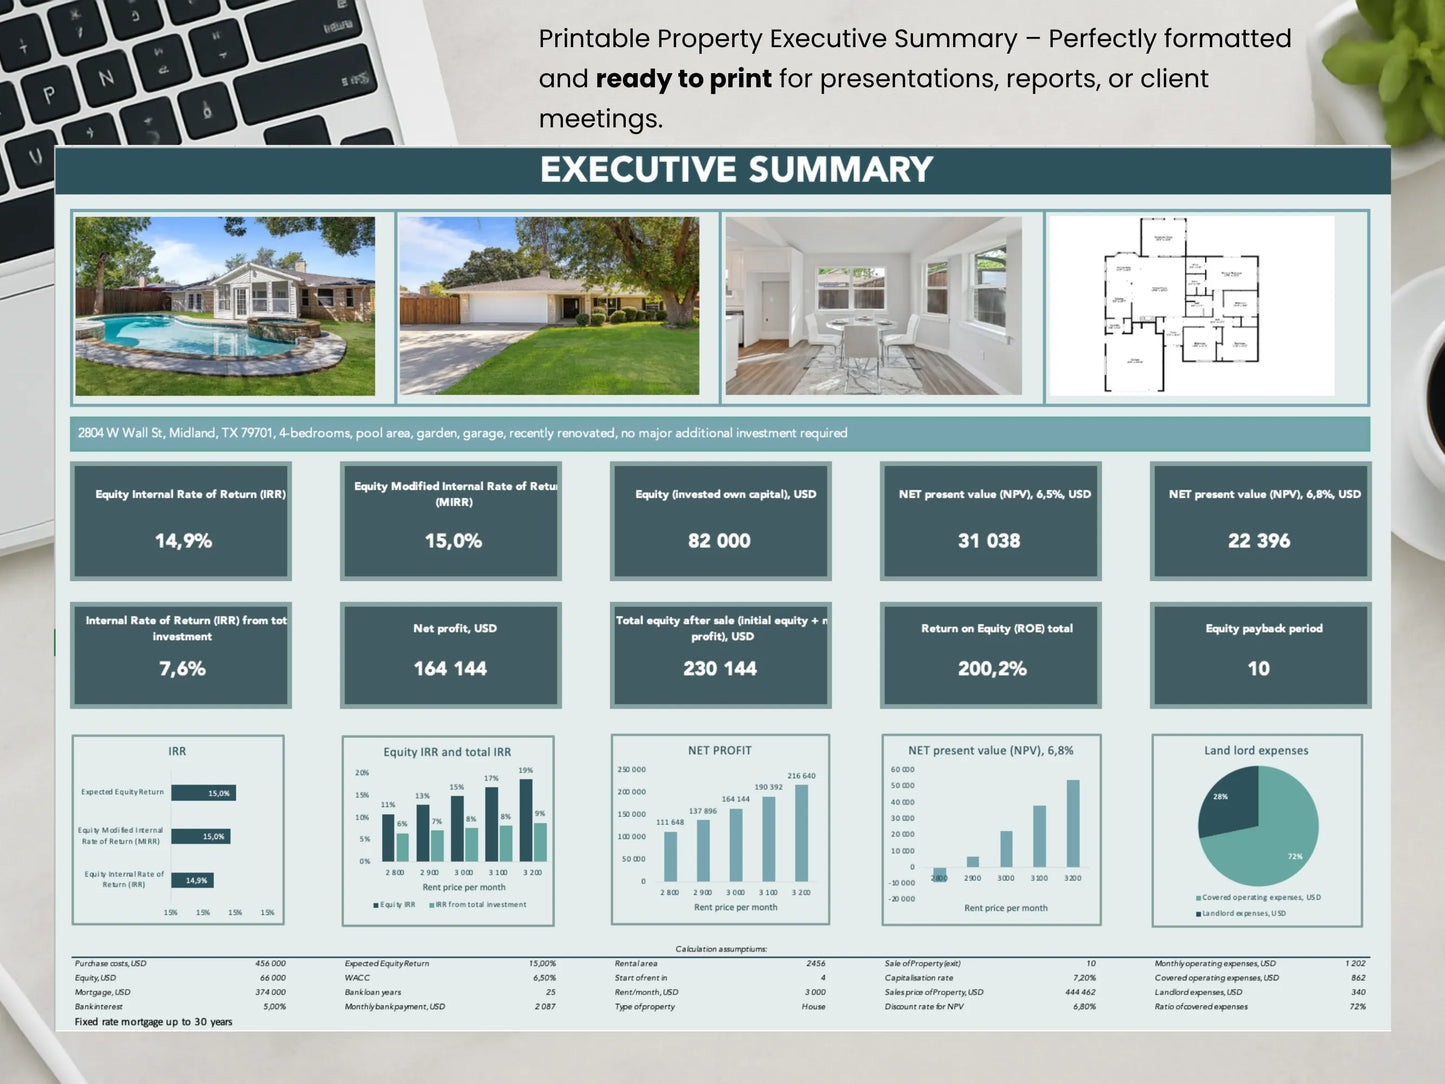
- Professional summaries – Generate printable investor reports.
- Currency flexibility – Work with multiple currencies (USD, EUR, GBP).
- Scenario simulation – Test rent changes, mortgage rates, or cost inflation.
- Data protection – All formulas locked for accuracy and reliability.
🏁 Final Thoughts
Understanding ROE vs ROI is essential for smart real estate investing.
ROI tells you whether the property is profitable—ROE tells you whether it’s truly worth your investment.
By comparing both metrics, you gain a complete picture of performance, risk, and leverage efficiency.
For real estate professionals, agents, and investors using spreadsheets, tracking ROE provides the clearest signal of long-term wealth creation.
Use our Real Estate Investment Calculator Pro Version or Real Estate Investment Calculator Pro Version + Test 5 Financing Methods to unlock insights instantly and invest like a pro.
